
What Communities Are in Genesee County, Michigan?
Everything you need to know about living in Genesee County, Michigan — communities, schools, parks, and lifestyle across 640 square miles of Mid-Michigan.
Jump to a Community
Community guide by Joyce England, REALTOR® · Keller Williams First
Genesee County is home to communities in Mid-Michigan, from small towns to suburban cities. Whether you're researching living in Genesee County for a potential move, exploring local neighborhoods, or simply curious about the area, this guide introduces each community — from schools and parks to local dining and neighborhood character.
What Makes Genesee County Special?
Genesee County is the heart of Mid-Michigan, home to approximately 402,000 residents across more than 30 townships, cities, and villages. The county seat is Flint, and the region includes well-known communities such as Grand Blanc, Fenton, Davison, Flushing, Clio, Goodrich, Linden, and Swartz Creek.
The area offers a blend of suburban convenience, community character, and outdoor recreation. Residents enjoy access to an extensive park system, more than 11,000 acres managed by the Genesee County Parks and Recreation Commission, including For-Mar Nature Preserve & Arboretum and the 27-mile Flint River Trail. For more outdoor options, explore our full Parks & Trails guide.
Living in Genesee County also means access to 21 public school districts, community colleges, and universities, with easy highway access via I-75, I-475, and I-69. The cost of living remains 4 to 15% below the national average, making it an attractive option for families, first-time buyers, and those relocating to Michigan. As of the latest available public data (Redfin, three months ending August 2026), Genesee County showed a median sold price of $239,000 and a median 46 days on market. A county-level months-of-inventory figure was not published in the latest data; the Michigan statewide months of supply sat at roughly 3 months. Homeowners looking for maintenance tips and seasonal guides can visit our Home & Garden section.
Quick Facts
Major Highways
Genesee County Single-Family Home Market Data
Single-family market statistics for Genesee County, Michigan and its communities, drawn from the latest publicly available data from Redfin and Realtor.com. Data period: latest available public data, 2026. Figures are shown exactly as reported. Where there was not enough market activity to calculate a statistic, or where a metric was not published by the source, that is noted below.
Genesee County, Michigan
CountywideSingle-Family · Latest available public data 2026 · Source: Redfin / Realtor.com
New Listings
| Median List Price | $223,000 | MoM 0.4% |
| # of Properties | 599 | MoM 10.2% |
| Median $/Sqft | $155 | MoM 0.6% |
| Total $ Volume | $147,736,875 | MoM 15.6% |
| Median Living Area Sqft | 1,420 | MoM 4.2% |
Active Listings
| Median List Price | $187,000 | MoM 4.1% |
| # of Properties | 1,211 | MoM 0.2% |
| Median Days in RPR | 52 | MoM 23.8% |
| Median $/Sqft | $132 | MoM 1.5% |
| Total $ Volume | $296,124,103 | MoM -2.8% |
| Median Living Area Sqft | 1,404 | MoM 1.5% |
New Pending Listings
| Median List Price | $229,900 | MoM 2.2% |
| # of Properties | 380 | MoM 11.2% |
| Median Days in RPR | 25 | MoM 19% |
| Median $/Sqft | $159 | MoM 1.2% |
| Total $ Volume | $95,962,406 | MoM 12.9% |
| Median Living Area Sqft | 1,468 | MoM 1.2% |
Pending Listings
| Median List Price | $229,900 | MoM 0.4% |
| # of Properties | 437 | MoM 1.1% |
| Median Days in RPR | 42 | MoM 100% |
| Median $/Sqft | $154 | MoM 2% |
| Total $ Volume | $121,950,991 | MoM 2.1% |
| Median Living Area Sqft | 1,494 | MoM 1% |
Sold Listings
| Median Sold Price | $239,000 | MoM – |
| # of Properties | 366 | MoM 10.5% |
| Sold to List Price % | 98.08% | MoM 0.1% |
| Median Days in RPR | 46 | MoM – |
| Median $/Sqft | $158 | MoM 3.7% |
| Total $ Volume | $90,463,215 | MoM 18.6% |
Months Supply of Inventory
Sold Public Records
| Median Sold Price | $133,000 | MoM 31.8% |
| # of Properties | 92 | MoM 82.9% |
| Median $/Sqft | $112 | MoM 23.3% |
| Median Living Area Sqft | 1,248 | MoM 2.7% |
| Total $ Volume | $14,801,078 | MoM 86.5% |
Burton, Michigan
Single-Family · Latest available public data 2026 · Source: Redfin / Realtor.com
New Listings
| Median List Price | $164,900 | MoM 7.1% |
| # of Properties | 65 | MoM 20.4% |
| Median $/Sqft | $147 | MoM 18.5% |
| Total $ Volume | $11,311,298 | MoM 34.4% |
| Median Living Area Sqft | 1,160 | MoM 7.1% |
Active Listings
| Median List Price | $164,900 | MoM 1.1% |
| # of Properties | 95 | MoM 13.1% |
| Median Days in RPR | 42 | MoM 35.5% |
| Median $/Sqft | $130 | MoM 4% |
| Total $ Volume | $16,652,850 | MoM 15% |
| Median Living Area Sqft | 1,250 | MoM 2% |
New Pending Listings
| Median List Price | $164,450 | MoM 0.3% |
| # of Properties | 38 | MoM 22.6% |
| Median Days in RPR | 21 | MoM 25% |
| Median $/Sqft | $131 | MoM 2.2% |
| Total $ Volume | $6,308,073 | MoM 15.2% |
| Median Living Area Sqft | 1,241 | MoM 0.6% |
Pending Listings
| Median List Price | $163,900 | MoM 1.9% |
| # of Properties | 41 | MoM 41.4% |
| Median Days in RPR | 43 | MoM 43.3% |
| Median $/Sqft | $130 | MoM 2.3% |
| Total $ Volume | $6,918,899 | MoM 28.4% |
| Median Living Area Sqft | 1,235 | MoM 3.8% |
Sold Listings
| Median Sold Price | $169,898 | MoM – |
| # of Properties | 27 | MoM 22.9% |
| Sold to List Price % | 99.82% | MoM 3.4% |
| Median Days in RPR | 33 | MoM – |
| Median $/Sqft | $132 | MoM 4.3% |
| Total $ Volume | $5,114,170 | MoM 14.9% |
Months Supply of Inventory
Sold Public Records
| Median Sold Price | $76,750 | MoM 52.3% |
| # of Properties | 10 | MoM 78.3% |
| Median $/Sqft | $93 | MoM 30.1% |
| Median Living Area Sqft | 1,047 | MoM 0.8% |
| Total $ Volume | $937,569 | MoM 87.1% |
Clio, Michigan
Single-Family · Latest available public data 2026 · Source: Redfin / Realtor.com
New Listings
| Median List Price | $249,500 | MoM 9.7% |
| # of Properties | 35 | MoM 45.8% |
| Median $/Sqft | $165 | MoM 7.3% |
| Total $ Volume | $9,723,549 | MoM 53.7% |
| Median Living Area Sqft | 1,400 | MoM 2.2% |
Active Listings
| Median List Price | $220,000 | MoM 2.2% |
| # of Properties | 53 | MoM 3.9% |
| Median Days in RPR | 53 | MoM 29.3% |
| Median $/Sqft | $162 | MoM 6.6% |
| Total $ Volume | $12,922,826 | MoM 7.8% |
| Median Living Area Sqft | 1,382 | MoM 6.3% |
New Pending Listings
| Median List Price | $254,900 | MoM 15.9% |
| # of Properties | 24 | MoM 4% |
| Median Days in RPR | 11 | MoM 59.3% |
| Median $/Sqft | $166 | MoM 12.9% |
| Total $ Volume | $6,300,677 | MoM 10.6% |
| Median Living Area Sqft | 1,492 | MoM 3.2% |
Pending Listings
| Median List Price | $249,900 | MoM 13.6% |
| # of Properties | 31 | MoM 29.2% |
| Median Days in RPR | 30 | MoM 3.2% |
| Median $/Sqft | $153 | MoM 5.5% |
| Total $ Volume | $7,980,999 | MoM 40.8% |
| Median Living Area Sqft | 1,512 | MoM 1.9% |
Sold Listings
| Median Sold Price | $175,000 | MoM – |
| # of Properties | 16 | MoM 55.6% |
| Sold to List Price % | 101.37% | MoM 4.1% |
| Median Days in RPR | 28 | MoM – |
| Median $/Sqft | $147 | MoM 12% |
| Total $ Volume | $3,692,700 | MoM 59.1% |
Months Supply of Inventory
Sold Public Records
| Median Sold Price | $277,500 | MoM 18.1% |
| # of Properties | 6 | MoM 68.4% |
| Median $/Sqft | $139 | MoM 16.3% |
| Median Living Area Sqft | 1,764 | MoM 9.6% |
| Total $ Volume | $1,760,000 | MoM 61.2% |
Davison, Michigan
Single-Family · Latest available public data 2026 · Source: Redfin / Realtor.com
New Listings
| Median List Price | $304,900 | MoM 17.3% |
| # of Properties | 45 | MoM 4.3% |
| Median $/Sqft | $192 | MoM 13.6% |
| Total $ Volume | $15,632,545 | MoM 14.6% |
| Median Living Area Sqft | 1,625 | MoM 0.4% |
Active Listings
| Median List Price | $340,000 | MoM 0% |
| # of Properties | 65 | MoM 6.6% |
| Median Days in RPR | 41 | MoM 41.4% |
| Median $/Sqft | $184 | MoM 1.1% |
| Total $ Volume | $21,393,256 | MoM 8% |
| Median Living Area Sqft | 1,709 | MoM 2.6% |
New Pending Listings
| Median List Price | $322,400 | MoM 7.5% |
| # of Properties | 22 | MoM 46.3% |
| Median Days in RPR | 20 | MoM 20% |
| Median $/Sqft | $193 | MoM 6.6% |
| Total $ Volume | $7,189,690 | MoM 46% |
| Median Living Area Sqft | 1,738 | MoM 5.1% |
Pending Listings
| Median List Price | $322,400 | MoM 11.9% |
| # of Properties | 24 | MoM 33.3% |
| Median Days in RPR | 25 | MoM 19% |
| Median $/Sqft | $177 | MoM 11.3% |
| Total $ Volume | $7,557,089 | MoM 32.8% |
| Median Living Area Sqft | 1,745 | MoM 0.2% |
Sold Listings
| Median Sold Price | $201,000 | MoM – |
| # of Properties | 31 | MoM 3.3% |
| Sold to List Price % | 99.34% | MoM 0.7% |
| Median Days in RPR | 8 | MoM – |
| Median $/Sqft | $176 | MoM 5.4% |
| Total $ Volume | $10,090,300 | MoM 13.7% |
Months Supply of Inventory
Sold Public Records
| Median Sold Price | $183,000 | MoM 33.5% |
| # of Properties | 7 | MoM 85.1% |
| Median $/Sqft | $122 | MoM 35.1% |
| Median Living Area Sqft | 1,372 | MoM 13% |
| Total $ Volume | $1,199,500 | MoM 90.9% |
Fenton, Michigan
Single-Family · Latest available public data 2026 · Source: Redfin / Realtor.com
New Listings
| Median List Price | $429,900 | MoM 14.6% |
| # of Properties | 51 | MoM 35.4% |
| Median $/Sqft | $226 | MoM 5.4% |
| Total $ Volume | $27,360,670 | MoM 38.2% |
| Median Living Area Sqft | 1,890 | MoM 5.5% |
Active Listings
| Median List Price | $427,450 | MoM 1.8% |
| # of Properties | 110 | MoM 5.2% |
| Median Days in RPR | 48 | MoM 45.5% |
| Median $/Sqft | $242 | MoM 1.6% |
| Total $ Volume | $72,195,441 | MoM 1.7% |
| Median Living Area Sqft | 1,873 | MoM 2% |
New Pending Listings
| Median List Price | $369,900 | MoM 5.2% |
| # of Properties | 39 | MoM 23.5% |
| Median Days in RPR | 28 | MoM 33.3% |
| Median $/Sqft | $250 | MoM 5% |
| Total $ Volume | $19,529,386 | MoM 24% |
| Median Living Area Sqft | 1,809 | MoM 4.2% |
Pending Listings
| Median List Price | $459,949 | MoM 5.7% |
| # of Properties | 42 | MoM 7.7% |
| Median Days in RPR | 51 | MoM 183.3% |
| Median $/Sqft | $254 | MoM 13.4% |
| Total $ Volume | $25,628,465 | MoM 22.1% |
| Median Living Area Sqft | 1,798 | MoM 6.4% |
Sold Listings
| Median Sold Price | $279,833 | MoM – |
| # of Properties | 36 | MoM 32.1% |
| Sold to List Price % | 97.58% | MoM 0.7% |
| Median Days in RPR | 49 | MoM – |
| Median $/Sqft | $227 | MoM 9.2% |
| Total $ Volume | $16,082,699 | MoM 49% |
Months Supply of Inventory
Sold Public Records
| Median Sold Price | $432,500 | MoM 0.6% |
| # of Properties | 10 | MoM 76.2% |
| Median $/Sqft | $238 | MoM 9.8% |
| Median Living Area Sqft | 1,738 | MoM 9.5% |
| Total $ Volume | $4,511,700 | MoM 81.3% |
Flint, Michigan
Single-Family · Latest available public data 2026 · Source: Redfin / Realtor.com
New Listings
| Median List Price | $84,950 | MoM 15% |
| # of Properties | 180 | MoM 11.8% |
| Median $/Sqft | $84 | MoM 3.4% |
| Total $ Volume | $19,648,996 | MoM 20.1% |
| Median Living Area Sqft | 1,147 | MoM 2.1% |
Active Listings
| Median List Price | $69,000 | MoM 6.2% |
| # of Properties | 485 | MoM 4.8% |
| Median Days in RPR | 60 | MoM 13.2% |
| Median $/Sqft | $61 | MoM 1.6% |
| Total $ Volume | $42,576,519 | MoM 3.3% |
| Median Living Area Sqft | 1,050 | MoM 0.9% |
New Pending Listings
| Median List Price | $114,900 | MoM 24.4% |
| # of Properties | 93 | MoM 17.7% |
| Median Days in RPR | 33 | MoM 37.5% |
| Median $/Sqft | $86 | MoM 14.7% |
| Total $ Volume | $11,120,397 | MoM 4.2% |
| Median Living Area Sqft | 1,214 | MoM 11.2% |
Pending Listings
| Median List Price | $99,900 | MoM 11.1% |
| # of Properties | 112 | MoM 15.2% |
| Median Days in RPR | 46 | MoM 109.1% |
| Median $/Sqft | $87 | MoM 3.6% |
| Total $ Volume | $12,313,385 | MoM 10.7% |
| Median Living Area Sqft | 1,145 | MoM 9.6% |
Sold Listings
| Median Sold Price | $50,000 | MoM – |
| # of Properties | 98 | MoM 6.7% |
| Sold to List Price % | 95.37% | MoM 1.4% |
| Median Days in RPR | 49 | MoM – |
| Median $/Sqft | $89 | MoM 20.3% |
| Total $ Volume | $11,115,120 | MoM 6.1% |
Months Supply of Inventory
Sold Public Records
| Median Sold Price | $40,000 | MoM 38.5% |
| # of Properties | 44 | MoM 78% |
| Median $/Sqft | $49 | MoM 21% |
| Median Living Area Sqft | 1,026 | MoM 4.2% |
| Total $ Volume | $4,003,894 | MoM 78.2% |
Flushing, Michigan
Single-Family · Latest available public data 2026 · Source: Redfin / Realtor.com
New Listings
| Median List Price | $239,000 | MoM 6.3% |
| # of Properties | 27 | MoM 44.9% |
| Median $/Sqft | $158 | MoM 6.5% |
| Total $ Volume | $7,740,599 | MoM 40.2% |
| Median Living Area Sqft | 1,580 | MoM 0.3% |
Active Listings
| Median List Price | $265,000 | MoM 0% |
| # of Properties | 65 | MoM 8.5% |
| Median Days in RPR | 52 | MoM 30% |
| Median $/Sqft | $153 | MoM 3.8% |
| Total $ Volume | $17,599,499 | MoM 8.3% |
| Median Living Area Sqft | 1,788 | MoM 1.4% |
New Pending Listings
| Median List Price | $259,900 | MoM 7.2% |
| # of Properties | 22 | MoM 21.4% |
| Median Days in RPR | 24 | MoM 4% |
| Median $/Sqft | $173 | MoM 0.6% |
| Total $ Volume | $6,373,399 | MoM 16.2% |
| Median Living Area Sqft | 1,481 | MoM 4.8% |
Pending Listings
| Median List Price | $239,900 | MoM 11.6% |
| # of Properties | 24 | MoM 22.6% |
| Median Days in RPR | 22 | MoM 37.5% |
| Median $/Sqft | $161 | MoM 0.6% |
| Total $ Volume | $6,423,099 | MoM 10.5% |
| Median Living Area Sqft | 1,554 | MoM 11% |
Sold Listings
| Median Sold Price | $246,000 | MoM – |
| # of Properties | 27 | MoM 3.6% |
| Sold to List Price % | 97.4% | MoM 0.7% |
| Median Days in RPR | 26 | MoM – |
| Median $/Sqft | $168 | MoM 2.4% |
| Total $ Volume | $6,574,700 | MoM 16.6% |
Months Supply of Inventory
Sold Public Records
| Median Sold Price | $212,500 | MoM 9.5% |
| # of Properties | 5 | MoM 87.2% |
| Median $/Sqft | $117 | MoM 28.7% |
| Median Living Area Sqft | 1,372 | MoM 8.8% |
| Total $ Volume | $921,500 | MoM 89.3% |
Genesee, Michigan
Single-Family · Latest available public data 2026 · Source: Redfin / Realtor.com
New Listings
| Median List Price | – | – |
| # of Properties | 1 | MoM 0% |
| Median $/Sqft | – | – |
| Total $ Volume | – | – |
| Median Living Area Sqft | – | – |
Active Listings
| Median List Price | $149,900 | MoM 16.7% |
| # of Properties | 3 | MoM 0% |
| Median Days in RPR | 34 | MoM 19% |
| Median $/Sqft | $157 | MoM 0% |
| Total $ Volume | $499,700 | MoM 5.7% |
| Median Living Area Sqft | 1,400 | MoM 0% |
New Pending Listings
There is not enough market activity at this location, for the selected property type, to display data.
Pending Listings
There is not enough market activity at this location, for the selected property type, to display data.
Sold Listings
There is not enough market activity at this location, for the selected property type, to display data.
Months Supply of Inventory
Sold Public Records
There is not enough market activity at this location, for the selected property type, to display data.
Goodrich, Michigan
Single-Family · Latest available public data 2026 · Source: Redfin / Realtor.com
New Listings
| Median List Price | $429,900 | MoM 22.9% |
| # of Properties | 16 | MoM 14.3% |
| Median $/Sqft | $211 | MoM 3.4% |
| Total $ Volume | $6,562,790 | MoM 24.8% |
| Median Living Area Sqft | 1,839 | MoM 1.5% |
Active Listings
| Median List Price | $439,900 | MoM 2.2% |
| # of Properties | 17 | MoM 10.5% |
| Median Days in RPR | 29 | MoM 6.5% |
| Median $/Sqft | $206 | MoM 2.4% |
| Total $ Volume | $7,178,600 | MoM 13.5% |
| Median Living Area Sqft | 1,839 | MoM 4.7% |
New Pending Listings
| Median List Price | $429,900 | MoM 40.2% |
| # of Properties | 9 | MoM 200% |
| Median Days in RPR | 21 | MoM 46.2% |
| Median $/Sqft | $251 | MoM 12.6% |
| Total $ Volume | $3,823,400 | MoM 51.2% |
| Median Living Area Sqft | 1,712 | MoM 51.6% |
Pending Listings
| Median List Price | $525,000 | – |
| # of Properties | 7 | MoM 250% |
| Median Days in RPR | 88 | – |
| Median $/Sqft | $251 | – |
| Total $ Volume | $3,752,700 | – |
| Median Living Area Sqft | 1,796 | – |
Sold Listings
| Median Sold Price | $329,835 | MoM – |
| # of Properties | 6 | MoM 20% |
| Sold to List Price % | 96.66% | MoM 0.9% |
| Median Days in RPR | 40 | MoM – |
| Median $/Sqft | $251 | MoM 12.6% |
| Total $ Volume | $2,535,100 | MoM 23.5% |
Months Supply of Inventory
Sold Public Records
There is not enough market activity at this location, for the selected property type, to display data.
Grand Blanc, Michigan
Single-Family · Latest available public data 2026 · Source: Redfin / Realtor.com
New Listings
| Median List Price | $370,000 | MoM 8.9% |
| # of Properties | 71 | MoM 16.5% |
| Median $/Sqft | $181 | MoM 0% |
| Total $ Volume | $25,485,162 | MoM 19.4% |
| Median Living Area Sqft | 1,960 | MoM 5.1% |
Active Listings
| Median List Price | $379,900 | MoM 0.2% |
| # of Properties | 140 | MoM 4.8% |
| Median Days in RPR | 52 | MoM 26.8% |
| Median $/Sqft | $181 | MoM 0% |
| Total $ Volume | $60,056,083 | MoM 5.3% |
| Median Living Area Sqft | 2,002 | MoM 2.2% |
New Pending Listings
| Median List Price | $350,000 | MoM 16.7% |
| # of Properties | 51 | MoM 8.9% |
| Median Days in RPR | 31 | MoM 40.9% |
| Median $/Sqft | $177 | MoM 2.7% |
| Total $ Volume | $17,214,478 | MoM 7.9% |
| Median Living Area Sqft | 1,957 | MoM 16.8% |
Pending Listings
| Median List Price | $347,367 | MoM 5.3% |
| # of Properties | 50 | MoM 12.3% |
| Median Days in RPR | 40 | MoM 90.5% |
| Median $/Sqft | $175 | MoM 2.8% |
| Total $ Volume | $17,322,578 | MoM 11.5% |
| Median Living Area Sqft | 1,967 | MoM 8.6% |
Sold Listings
| Median Sold Price | $301,000 | MoM – |
| # of Properties | 55 | MoM 12.2% |
| Sold to List Price % | 98.61% | MoM 1.2% |
| Median Days in RPR | 50 | MoM – |
| Median $/Sqft | $176 | MoM 4.3% |
| Total $ Volume | $17,768,926 | MoM 7.9% |
Months Supply of Inventory
Sold Public Records
| Median Sold Price | $191,950 | MoM 31.4% |
| # of Properties | 6 | MoM 91.8% |
| Median $/Sqft | $125 | MoM 27.7% |
| Median Living Area Sqft | 1,578 | MoM 2.3% |
| Total $ Volume | $1,431,900 | MoM 93.7% |
Linden, Michigan
Single-Family · Latest available public data 2026 · Source: Redfin / Realtor.com
New Listings
| Median List Price | $425,000 | MoM 5.9% |
| # of Properties | 35 | MoM 20.5% |
| Median $/Sqft | $221 | MoM 6.3% |
| Total $ Volume | $14,826,302 | MoM 23% |
| Median Living Area Sqft | 1,888 | MoM 0.4% |
Active Listings
| Median List Price | $450,000 | MoM 0% |
| # of Properties | 72 | MoM 10% |
| Median Days in RPR | 60 | MoM 36.4% |
| Median $/Sqft | $206 | MoM 1.4% |
| Total $ Volume | $33,671,970 | MoM 12.2% |
| Median Living Area Sqft | 2,054 | MoM 0.1% |
New Pending Listings
| Median List Price | $396,560 | MoM 3.4% |
| # of Properties | 27 | MoM 3.6% |
| Median Days in RPR | 29 | MoM 70.6% |
| Median $/Sqft | $240 | MoM 11.6% |
| Total $ Volume | $12,140,608 | MoM 7.9% |
| Median Living Area Sqft | 1,796 | MoM 1.9% |
Pending Listings
| Median List Price | $425,000 | MoM 0.6% |
| # of Properties | 43 | MoM 7.5% |
| Median Days in RPR | – | – |
| Median $/Sqft | $225 | MoM 2.7% |
| Total $ Volume | $19,460,549 | MoM 10.3% |
| Median Living Area Sqft | 1,881 | MoM 2.2% |
Sold Listings
| Median Sold Price | $320,308 | MoM – |
| # of Properties | 23 | MoM 28.1% |
| Sold to List Price % | 99.03% | MoM 0.1% |
| Median Days in RPR | 18 | MoM – |
| Median $/Sqft | $218 | MoM 6% |
| Total $ Volume | $10,250,150 | MoM 25.7% |
Months Supply of Inventory
Sold Public Records
| Median Sold Price | $402,500 | MoM 10.7% |
| # of Properties | 4 | MoM 81.8% |
| Median $/Sqft | $212 | MoM 13.5% |
| Median Living Area Sqft | 1,813 | MoM 26.2% |
| Total $ Volume | $1,546,215 | MoM 84.6% |
Montrose, Michigan
Single-Family · Latest available public data 2026 · Source: Redfin / Realtor.com
New Listings
| Median List Price | $224,450 | MoM 0.2% |
| # of Properties | 14 | MoM 75% |
| Median $/Sqft | $139 | MoM 8.6% |
| Total $ Volume | $3,115,500 | MoM 69.4% |
| Median Living Area Sqft | 1,393 | MoM 13.5% |
Active Listings
| Median List Price | $218,900 | MoM 28.8% |
| # of Properties | 18 | MoM 38.5% |
| Median Days in RPR | 26 | MoM 36.6% |
| Median $/Sqft | $129 | MoM 3.2% |
| Total $ Volume | $4,002,199 | MoM 57.5% |
| Median Living Area Sqft | 1,335 | MoM 11.3% |
New Pending Listings
| Median List Price | $172,450 | MoM 29.6% |
| # of Properties | 10 | MoM 100% |
| Median Days in RPR | 10 | MoM 150% |
| Median $/Sqft | $152 | MoM 1.3% |
| Total $ Volume | $1,914,500 | MoM 17.8% |
| Median Living Area Sqft | 1,289 | MoM 27.6% |
Pending Listings
| Median List Price | $175,000 | MoM 17.6% |
| # of Properties | 9 | MoM 125% |
| Median Days in RPR | – | – |
| Median $/Sqft | $151 | MoM 7.1% |
| Total $ Volume | $1,789,600 | MoM 65% |
| Median Living Area Sqft | 1,378 | MoM 23% |
Sold Listings
| Median Sold Price | $212,000 | MoM – |
| # of Properties | 5 | MoM 0% |
| Sold to List Price % | 101.24% | MoM 0.6% |
| Median Days in RPR | 54 | MoM – |
| Median $/Sqft | $135 | MoM 23.3% |
| Total $ Volume | $1,139,400 | MoM 36.9% |
Months Supply of Inventory
Sold Public Records
There is not enough market activity at this location, for the selected property type, to display data.
Mount Morris, Michigan
Single-Family · Latest available public data 2026 · Source: Redfin / Realtor.com
New Listings
| Median List Price | $135,000 | MoM 6.8% |
| # of Properties | 27 | MoM 18.2% |
| Median $/Sqft | $133 | MoM 13.7% |
| Total $ Volume | $4,816,339 | MoM 5.9% |
| Median Living Area Sqft | 1,198 | MoM 5.1% |
Active Listings
| Median List Price | $124,900 | MoM 5% |
| # of Properties | 52 | MoM 14.8% |
| Median Days in RPR | 53 | MoM 5.4% |
| Median $/Sqft | $108 | MoM 11.3% |
| Total $ Volume | $7,262,386 | MoM 5.9% |
| Median Living Area Sqft | 1,147 | MoM 2.6% |
New Pending Listings
| Median List Price | $134,900 | MoM 7% |
| # of Properties | 17 | MoM 5.6% |
| Median Days in RPR | 37 | MoM 208.3% |
| Median $/Sqft | $129 | MoM 8.4% |
| Total $ Volume | $2,735,490 | MoM 7.2% |
| Median Living Area Sqft | 1,092 | MoM 6.3% |
Pending Listings
| Median List Price | $162,450 | MoM 12% |
| # of Properties | 18 | MoM 12.5% |
| Median Days in RPR | 56 | MoM 460% |
| Median $/Sqft | $113 | MoM 6.6% |
| Total $ Volume | $3,333,740 | MoM 26.1% |
| Median Living Area Sqft | 1,246 | MoM 4.3% |
Sold Listings
| Median Sold Price | $127,000 | MoM 21.5% |
| # of Properties | 18 | MoM 50% |
| Sold to List Price % | 97.55% | MoM 1.8% |
| Median Days in RPR | 21 | MoM 61.5% |
| Median $/Sqft | $132 | MoM 0% |
| Total $ Volume | $2,825,550 | MoM 35.8% |
Months Supply of Inventory
Sold Public Records
There is not enough market activity at this location, for the selected property type, to display data.
Otisville, Michigan
Single-Family · Latest available public data 2026 · Source: Redfin / Realtor.com
New Listings
| Median List Price | – | – |
| # of Properties | 2 | MoM 75% |
| Median $/Sqft | – | – |
| Total $ Volume | – | – |
| Median Living Area Sqft | – | – |
Active Listings
| Median List Price | $251,400 | MoM 14.3% |
| # of Properties | 4 | MoM 42.9% |
| Median Days in RPR | 35 | MoM 191.7% |
| Median $/Sqft | $209 | MoM 41.2% |
| Total $ Volume | $1,260,299 | MoM 30.9% |
| Median Living Area Sqft | 1,347 | MoM 2% |
New Pending Listings
| Median List Price | $143,500 | MoM 20.2% |
| # of Properties | 4 | MoM 20% |
| Median Days in RPR | 48 | MoM 300% |
| Median $/Sqft | $123 | MoM 24.1% |
| Total $ Volume | $681,800 | MoM 28.6% |
| Median Living Area Sqft | 1,234 | MoM 5.9% |
Pending Listings
| Median List Price | $157,000 | MoM 33.2% |
| # of Properties | 7 | MoM 16.7% |
| Median Days in RPR | 20 | MoM 17.6% |
| Median $/Sqft | $160 | MoM 9.6% |
| Total $ Volume | $1,351,800 | MoM 20.9% |
| Median Living Area Sqft | 1,312 | MoM 3% |
Sold Listings
| Median Sold Price | $238,750 | MoM 21.5% |
| # of Properties | 4 | MoM 20% |
| Sold to List Price % | 104.24% | MoM 2.8% |
| Median Days in RPR | 16 | MoM 77.8% |
| Median $/Sqft | $192 | MoM 5.9% |
| Total $ Volume | $1,199,500 | MoM 11.3% |
Months Supply of Inventory
Sold Public Records
There is not enough market activity at this location, for the selected property type, to display data.
Swartz Creek, Michigan
Single-Family · Latest available public data 2026 · Source: Redfin / Realtor.com
New Listings
| Median List Price | $235,000 | MoM 13.4% |
| # of Properties | 38 | MoM 18.8% |
| Median $/Sqft | $170 | MoM 8.6% |
| Total $ Volume | $10,063,799 | MoM 7.8% |
| Median Living Area Sqft | 1,501 | MoM 2.4% |
Active Listings
| Median List Price | $259,900 | MoM 3.7% |
| # of Properties | 43 | MoM 15.7% |
| Median Days in RPR | 50 | MoM 42.9% |
| Median $/Sqft | $173 | MoM 5.5% |
| Total $ Volume | $12,170,449 | MoM 19.2% |
| Median Living Area Sqft | 1,530 | MoM 0% |
New Pending Listings
| Median List Price | $249,000 | MoM 1.2% |
| # of Properties | 33 | MoM 43.5% |
| Median Days in RPR | 15 | MoM 25% |
| Median $/Sqft | $185 | MoM 2.6% |
| Total $ Volume | $8,589,099 | MoM 33.8% |
| Median Living Area Sqft | 1,446 | MoM 1.1% |
Pending Listings
| Median List Price | $246,950 | MoM 5% |
| # of Properties | 36 | MoM 44% |
| Median Days in RPR | 59 | MoM 195% |
| Median $/Sqft | $166 | MoM 7.8% |
| Total $ Volume | $16,980,789 | MoM 13% |
| Median Living Area Sqft | 1,418 | MoM 1% |
Sold Listings
| Median Sold Price | $216,000 | MoM – |
| # of Properties | 21 | MoM 0% |
| Sold to List Price % | 99.54% | MoM 1.4% |
| Median Days in RPR | 18 | MoM – |
| Median $/Sqft | $201 | MoM 5.2% |
| Total $ Volume | $6,316,800 | MoM 18.4% |
Months Supply of Inventory
Sold Public Records
| Median Sold Price | $175,000 | MoM 34% |
| # of Properties | 5 | MoM 80% |
| Median $/Sqft | $191 | MoM 7.9% |
| Median Living Area Sqft | 1,050 | MoM 24.7% |
| Total $ Volume | $833,000 | MoM 88.1% |
Notes: Data reflects the latest publicly available single-family (SFR) market statistics from Redfin and Realtor.com for 2026. “MoM” is the month-over-month change. “–” indicates the statistic was not available from the source. Where a metric was not published by the source, no data is displayed.
Which Genesee County Communities Are Right for You?

Clio
A quiet, affordable community with miles of bike paths, Buell Lake, and easy I-75 access.
Davison
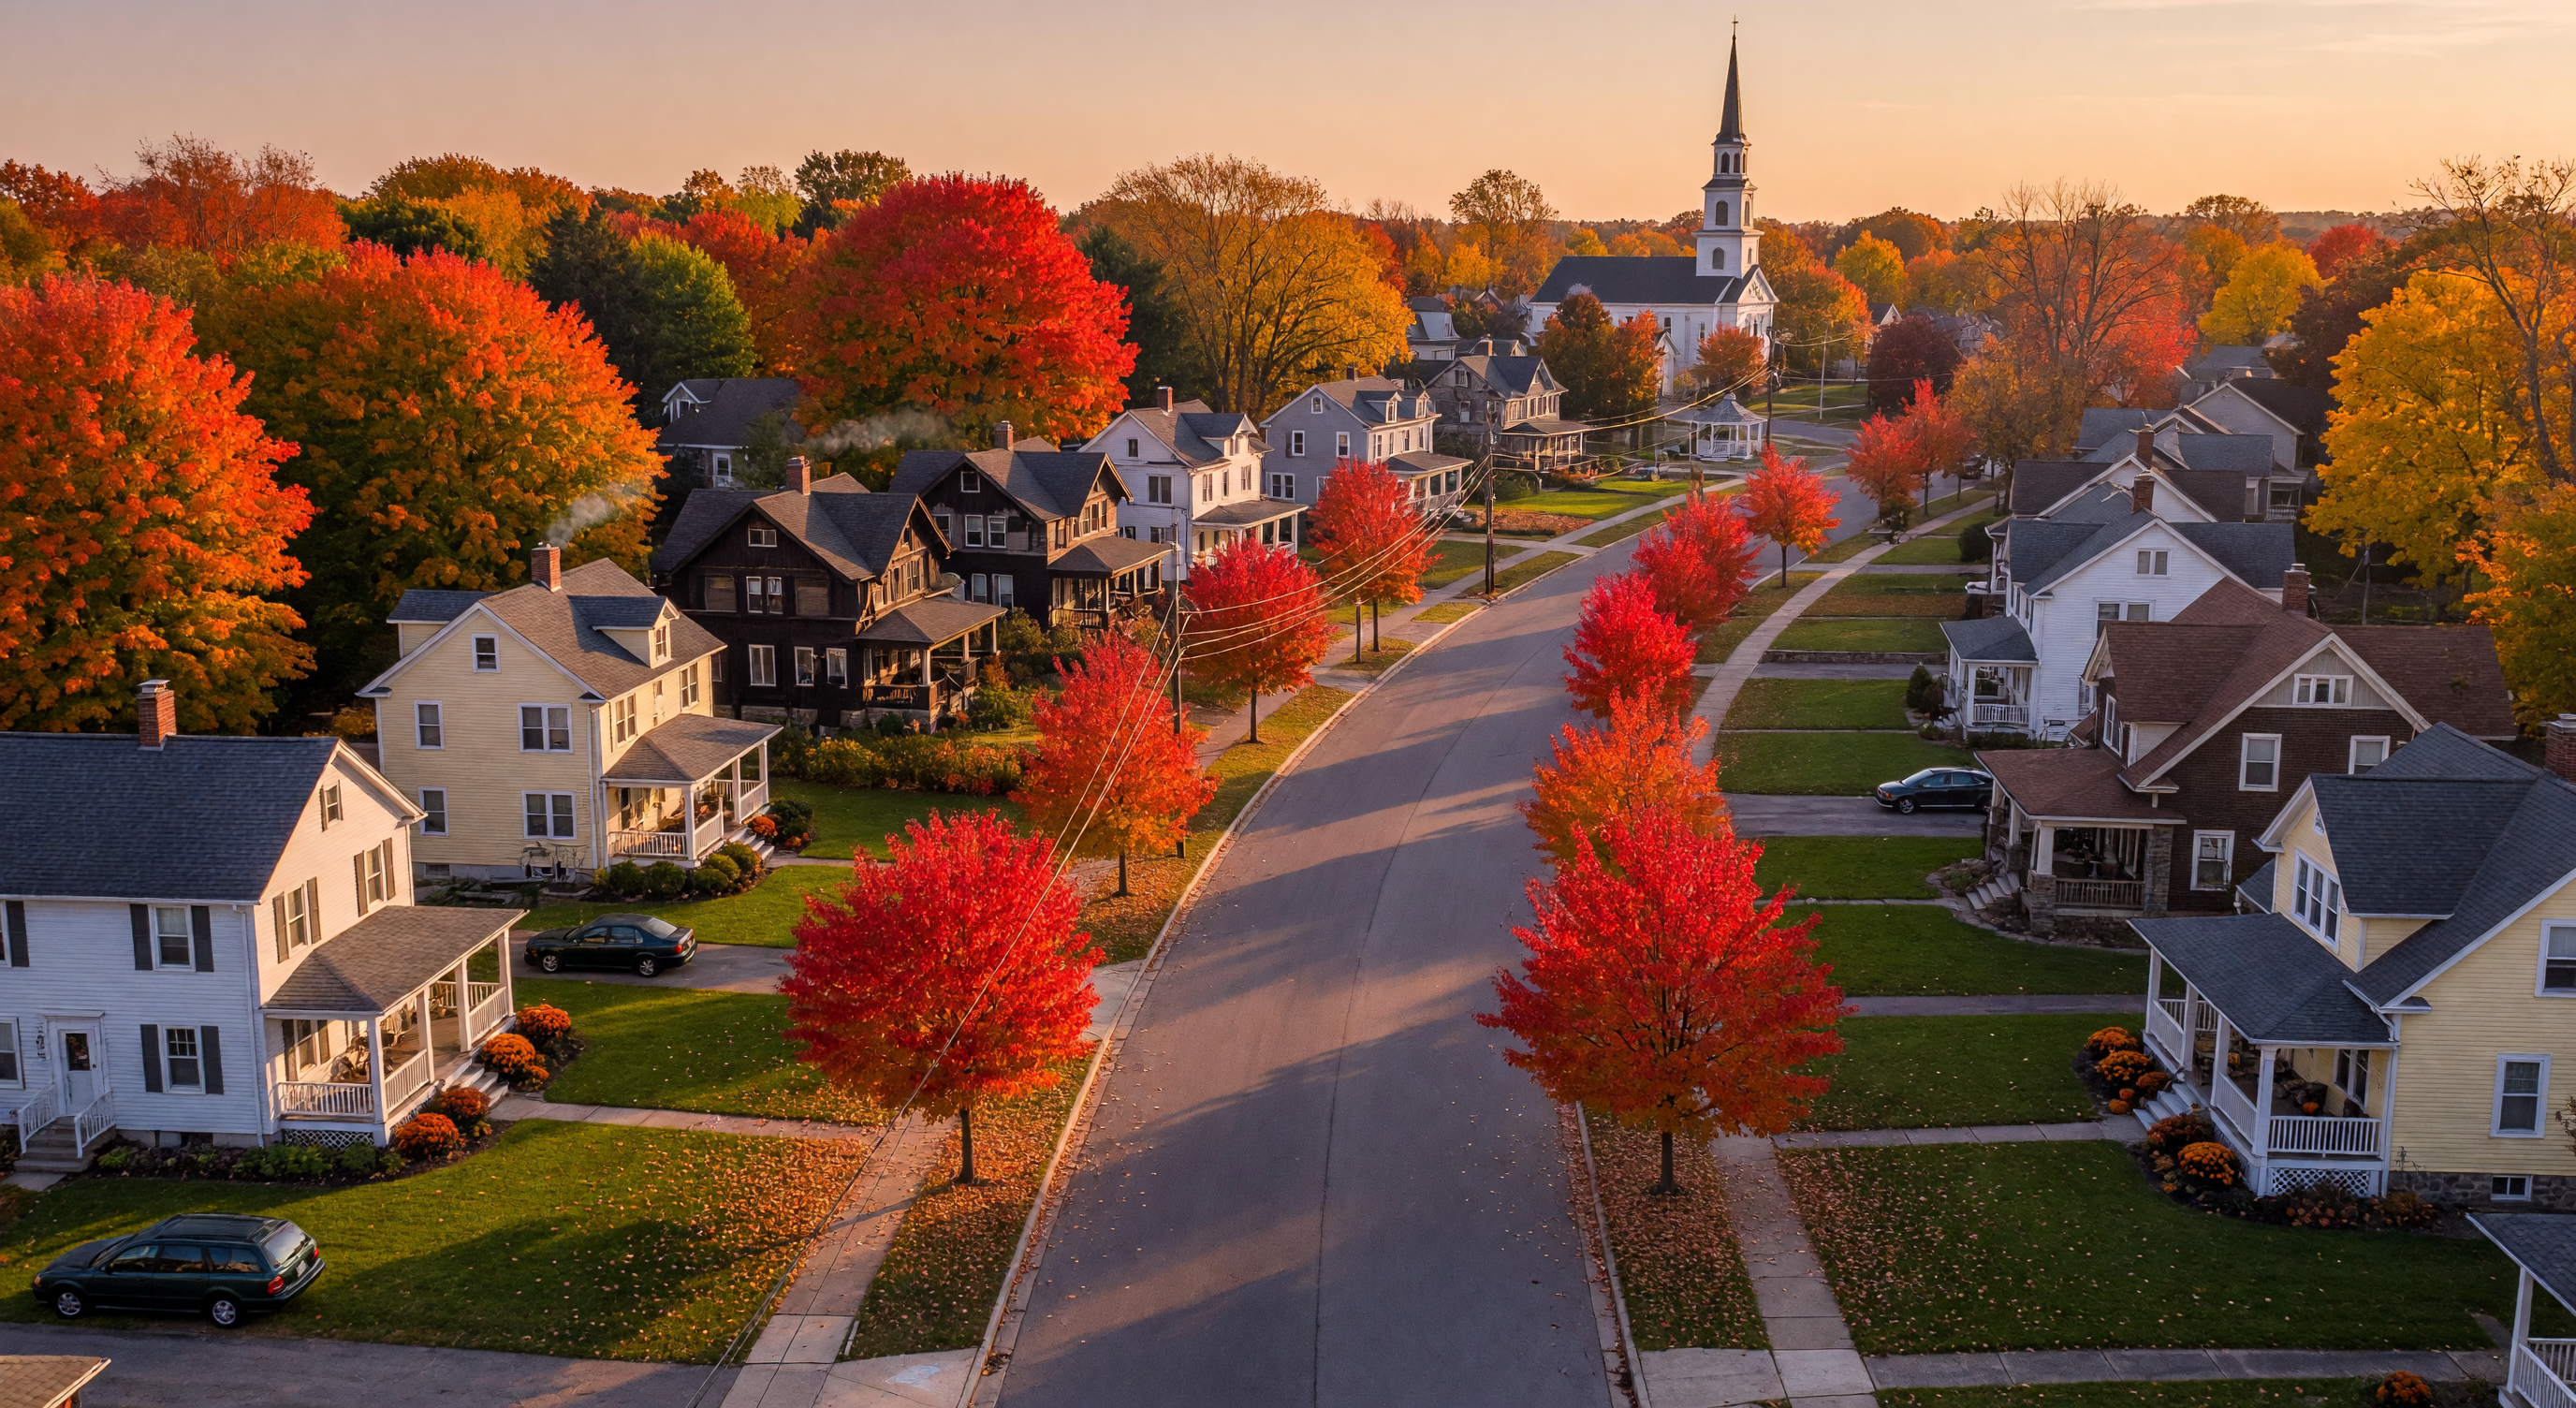
A small-town layout with a central downtown, schools, and easy access to major highways and Flint.

Fenton
Lakeside living with a walkable downtown, local dining, and year-round outdoor recreation.

Flint Township
Central location with established neighborhoods and convenient shopping and dining.

Flushing
Historic architecture, a walkable downtown, and riverside parks.

Genesee
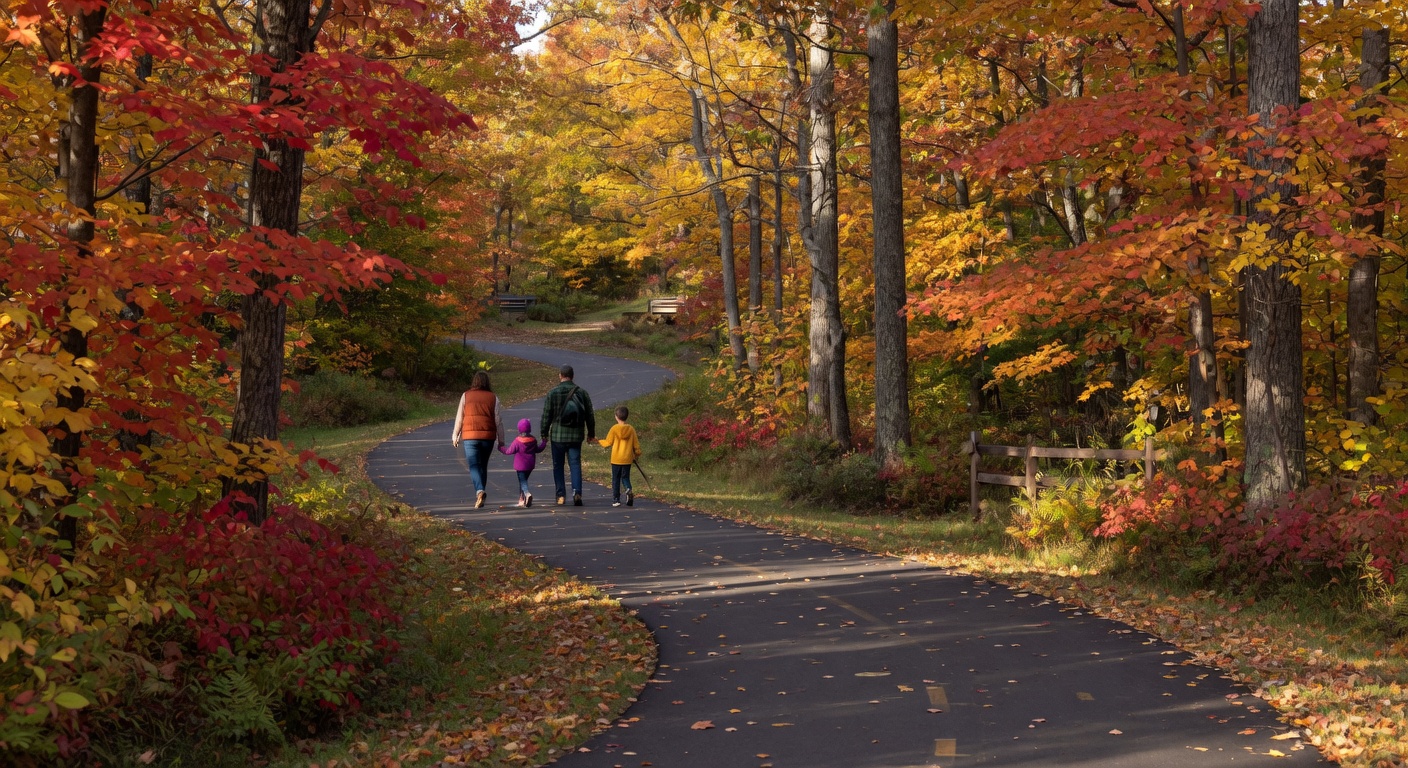
A suburban-rural community with spacious lots, parks, and a central Genesee County location.
Goodrich
A rural community with schools and easy access to major routes.

Grand Blanc
A community known for its schools, parks, and convenient access to I-75 and I-475.
Linden
Residential streets, community events, and a convenient location between Flint and Fenton.

Swartz Creek
A city with schools, established neighborhoods, and convenient access to I-69 and US-23.
What Are the Parks in Genesee County?
For-Mar Nature Preserve & Arboretum
Over 383 acres with 7 miles of hiking trails, an accredited arboretum, and nature education programs.
Learn MoreSeven Lakes State Park
More than 1,400 acres with six lakes, camping, swimming, and hiking in Holly.
Learn MoreFlint River Trail
A 27-mile paved multi-use trail connecting urban and natural landscapes throughout Genesee County.
Learn MoreStepping Stone Falls
A scenic waterfall on the Flint River, a popular spot for photography and picnicking.
Learn MoreCommon Questions About Genesee County, Michigan
Which Genesee County communities do buyers research most?
Grand Blanc, Fenton, Davison, and Swartz Creek are frequently researched choices. Grand Blanc is known for its schools and parks, while Fenton offers lakeside living and a walkable downtown. Davison and Swartz Creek combine community character with easy highway access to Flint and beyond.
What should I know about Genesee County neighborhoods?
Genesee County includes communities such as Grand Blanc, Fenton, Davison, Flushing, Swartz Creek, Argentine Township, and Flushing Township, each with its own housing stock, schools, parks, and commute options. Law enforcement and public safety data are published by local agencies; prospective buyers are encouraged to review current sources and speak with local professionals.
How far is Genesee County from Detroit?
Genesee County is approximately 70 miles north of Detroit via I-75, with a typical drive time of one hour to one hour and twenty minutes depending on traffic. Many residents commute to the Detroit metro area, and the county offers a significantly lower cost of living compared to southeast Michigan.
What is the average home price in Genesee County?
As of the latest available public data (Redfin, 2026), Genesee County showed a median sold price of $239,000. Prices vary significantly by community, with Linden (around $320,000) and Goodrich (around $330,000) commanding premium pricing, Grand Blanc around $301,000, Fenton around $280,000, Davison around $201,000, Swartz Creek around $216,000, and more affordable options in Flint, Burton, and Montrose.
What outdoor activities are available in Genesee County?
The county manages more than 11,000 acres of parks, including For-Mar Nature Preserve & Arboretum and Seven Lakes State Park. Residents enjoy the 27-mile Flint River Trail, Stepping Stone Falls, fishing, kayaking, cross-country skiing, and community farmers' markets throughout the year.
What schools serve Genesee County communities?
Genesee County is home to more than 20 public school districts. Grand Blanc Community Schools, Fenton Area Public Schools, Davison Community Schools, and Lake Fenton Community Schools are among the most recognized. The county also offers charter schools, private options, Mott Community College, and University of Michigan–Flint.
Genesee County Guides & Resources
Genesee County Community Guide
A comprehensive guide to every community — home prices, school districts, commute times, and investment potential.
Grand BlancTop 10 Reasons to Move to Grand Blanc
Schools, community events, location convenience, housing options, parks, and dining.
Grand BlancGrand Blanc: More Than Just a Commuter Town
Downtown, golf courses, parks, schools, and community events — a town with real identity and staying power.
Fenton & LindenFenton and Linden: Communities with Growing Appeal
Revitalized downtowns, lake access, schools, and increasing buyer interest.
Clio & GoodrichClio, Goodrich, and Genesee Township Community Guides
Affordability, community character, schools, and growing buyer interest in northern Genesee County.
Buyer GuideWhat to Know Before Buying a Home in Genesee County
Neighborhoods, school districts, commute options, flood zones, taxes, and local favorites.
Outdoor RecreationBest Parks and Outdoor Recreation in Genesee County
Top parks, trails, and outdoor activities — from Stepping Stone Falls to the Genesee County Parks system.
Family ActivitiesFamily-Friendly Day Trips in Genesee County
Crossroads Village, For-Mar, Bluebell Beach, splash pads, and budget-friendly weekend ideas.
Commuter GuideMid-Michigan Commuter Guide
Practical drive times from Grand Blanc, Fenton, Holly, and Davison to Detroit, Ann Arbor, and Lansing.