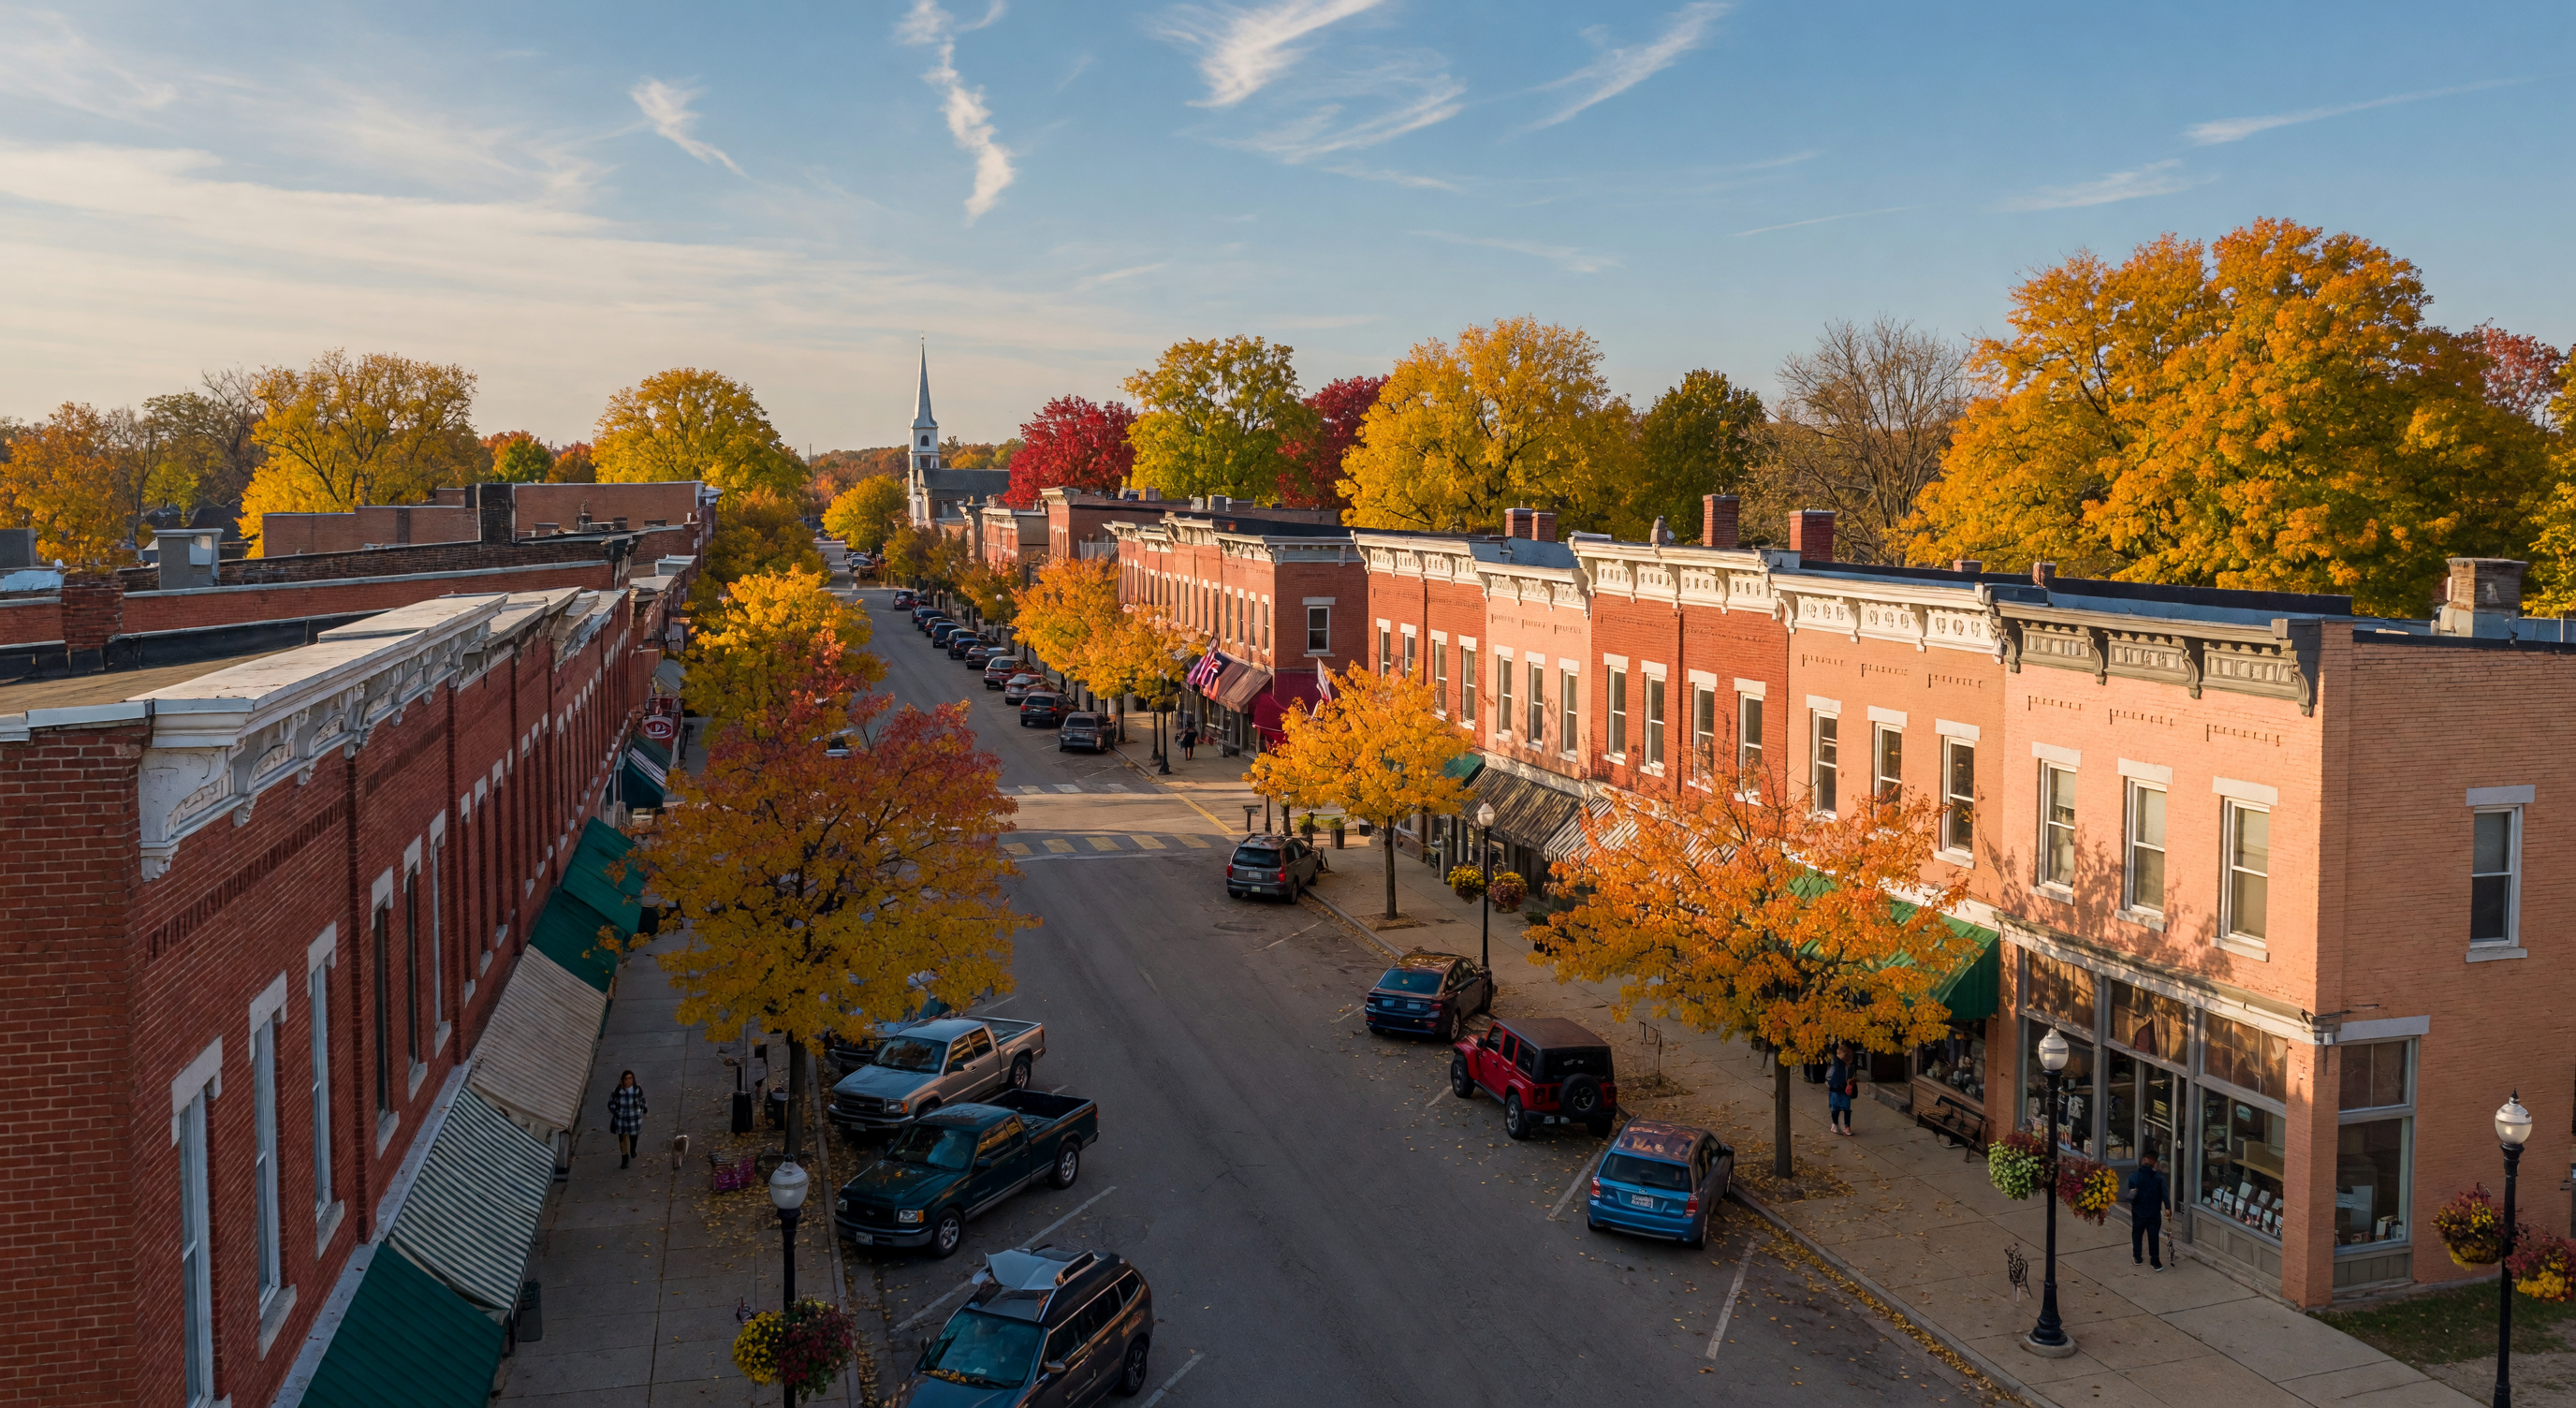
Which Communities Are in Livingston County, Michigan?
Everything you need to know about living in Livingston County, Michigan — communities, schools, parks, lakes, and lifestyle across 585 square miles of southeastern Michigan.
Community guide by Joyce England, REALTOR® · Keller Williams First
Livingston County is a common choice in southeastern Michigan, home to communities with schools, parks, and residential neighborhoods like Brighton, Howell, Hartland, and Pinckney. Known for its schools, lakes, and extensive state recreation areas, Livingston County is home to families and professionals commuting to both Detroit and Ann Arbor. Whether you're researching living in Livingston County for a potential move or exploring Livingston County real estate, this guide introduces each community and what the area offers.
Why Move to Livingston County Michigan?
Looking for a complete overview? Visit our Livingston County Living Guide for a comprehensive resource covering communities, school districts, housing market, parks, dining, healthcare, commute times, and cost of living.
Livingston County is a common choice in southeastern Michigan, home to nearly 200,000 residents across a mix of cities, townships, and villages. The county's median household income exceeds $100,000, and its 30+ lakes and extensive state recreation areas draw outdoor enthusiasts. The county seat is Howell, and the region includes well-known communities such as Brighton, Howell, Hartland, Hamburg Township, Pinckney, Fowlerville, Genoa Township, Oceola Township, Marion Township, Tyrone Township, Cohoctah, and Conway Township. Nearby bordering communities including Milford, Fenton, and Argentine Township are also commonly searched alongside Livingston County communities.
The area is served by several local school districts, with abundant lakes, extensive park networks, and easy access to major employment centers. Livingston County features more than 30 inland lakes, thousands of acres of state recreation areas, and an extensive network of trail systems in southeastern Michigan — including the nearly 5,000-acre Brighton Recreation Area and Island Lake State Recreation Area along the Huron River. For more outdoor options, explore our full Parks & Trails guide.
Living in Livingston County also means access to multiple public school districts, more than 10,000 acres of state recreation areas, and convenient positioning along the I-96 and US-23 corridor, giving residents easy access to communities across Mid-Michigan, Ann Arbor, Detroit, Lansing, and Flint. The county offers outdoor recreation, a range of housing options, and residential communities throughout the I-96 and US-23 corridor.
Quick Facts
Major Highways
Explore Livingston County
Whether you're buying, selling, or relocating to Livingston County, I'm here to help you find the right community for your lifestyle.
Call Joyce 810-513-3335Livingston County Single-Family Home Market Statistics
All market figures below (median sold price, median days on market, months of inventory, months supply, listing-activity tables, and sold public records) are from Realtors Property Resource (RPR), LLC data for single-family properties in September 2026, unless a provider indicates there was not enough market activity to calculate a statistic, in which case the data is noted as not available or insufficient. Excludes condos, townhouses, co-ops, and multi-family properties.
Livingston County (Countywide)
Livingston County, Michigan
CountywideSingle-Family · RPR (Realtors Property Resource), September 2026
New Listings
| Median List Price | $450,000 | – |
| # of Properties | 282 | – |
| Median $/Sqft | $240 | – |
| Total $ Volume | $151,242,296 | – |
| Median Living Area Sqft | 1,908 | – |
Active Listings
| Median List Price | $497,000 | – |
| # of Properties | 398 | – |
| Median Days on Market | 39 | – |
| Median $/Sqft | $249 | – |
| Total $ Volume | $243,494,606 | – |
| Median Living Area Sqft | 2,022 | – |
New Pending Listings
| Median List Price | $419,900 | – |
| # of Properties | 177 | – |
| Median Days on Market | 21 | – |
| Median $/Sqft | $236 | – |
| Total $ Volume | $87,574,354 | – |
| Median Living Area Sqft | 1,919 | – |
Pending Listings
| Median List Price | $425,000 | – |
| # of Properties | 165 | – |
| Median Days on Market | 24 | – |
| Median $/Sqft | $224 | – |
| Total $ Volume | $82,470,188 | – |
| Median Living Area Sqft | 2,087 | – |
Sold Listings
| Median Sold Price | $440,000 | MoM 3.3% |
| # of Properties | 201 | – |
| Sold to List Price % | 99.37% | – |
| Median Days on Market | 15 | – |
| Median $/Sqft | $247 | – |
| Total $ Volume | $104,395,782 | – |
Months Supply of Inventory
Sold Public Records
| Median Sold Price | $444,250 | – |
| # of Properties | 79 | – |
| Median $/Sqft | $237 | – |
| Median Living Area Sqft | 1,814 | – |
| Total $ Volume | $39,031,165 | – |
Community-Level Data (Single-Family Homes)
Data availability varies by community. Smaller townships with low transaction volumes may not have specific single-family home metrics published by major data providers. Where data was not found, it is noted as "Not available."
Fowlerville, Michigan
Single-Family · RPR (Realtors Property Resource), September 2026
New Listings
| Median List Price | $380,000 | – |
| # of Properties | 17 | – |
| Median $/Sqft | $213 | – |
| Total $ Volume | $6,917,535 | – |
| Median Living Area Sqft | 1,822 | – |
Active Listings
| Median List Price | $397,400 | – |
| # of Properties | 30 | – |
| Median Days on Market | 49 | – |
| Median $/Sqft | $213 | – |
| Total $ Volume | $14,112,124 | – |
| Median Living Area Sqft | 1,910 | – |
New Pending Listings
| Median List Price | $354,900 | – |
| # of Properties | 17 | – |
| Median Days on Market | 13 | – |
| Median $/Sqft | $192 | – |
| Total $ Volume | $6,416,735 | – |
| Median Living Area Sqft | 1,912 | – |
Pending Listings
| Median List Price | $359,950 | – |
| # of Properties | 16 | – |
| Median Days on Market | 21 | – |
| Median $/Sqft | $191 | – |
| Total $ Volume | $6,006,835 | – |
| Median Living Area Sqft | 1,889 | – |
Sold Listings
| Median Sold Price | $317,500 | MoM 11.19% |
| # of Properties | 18 | – |
| Sold to List Price % | 99.98% | – |
| Median Days on Market | 26 | – |
| Median $/Sqft | $179 | – |
| Total $ Volume | $5,767,686 | – |
Months Supply of Inventory
Sold Public Records
| Median Sold Price | $308,000 | – |
| # of Properties | 5 | – |
| Median $/Sqft | $143 | – |
| Median Living Area Sqft | 1,736 | – |
| Total $ Volume | $1,319,000 | – |
Deerfield, Michigan
Single-Family · RPR (Realtors Property Resource), September 2026
New Listings
| Median List Price | – | – |
| # of Properties | 1 | MoM 0% |
| Median $/Sqft | – | – |
| Total $ Volume | – | – |
| Median Living Area Sqft | – | – |
Active Listings
There is not enough market activity at this location, for the selected property type, to display data.
New Pending Listings
| Median List Price | – | – |
| # of Properties | 2 | MoM 100% |
| Median Days on Market | – | – |
| Median $/Sqft | – | – |
| Total $ Volume | – | – |
| Median Living Area Sqft | – | – |
Pending Listings
There is not enough market activity at this location, for the selected property type, to display data.
Sold Listings
| Median Sold Price | $234,900 | – |
| # of Properties | 3 | – |
| Sold to List Price % | 99.17% | – |
| Median Days on Market | 5 | – |
| Median $/Sqft | $208 | – |
| Total $ Volume | $1,165,900 | – |
Months Supply of Inventory
There is not enough market activity at this location, for the selected property type, to display data.
Sold Public Records
There is not enough market activity at this location, for the selected property type, to display data.
Howell, Michigan
Single-Family · RPR (Realtors Property Resource), September 2026
New Listings
| Median List Price | $425,000 | – |
| # of Properties | 109 | – |
| Median $/Sqft | $234 | – |
| Total $ Volume | $55,524,211 | – |
| Median Living Area Sqft | 1,808 | – |
Active Listings
| Median List Price | $475,000 | – |
| # of Properties | 107 | – |
| Median Days on Market | 21 | – |
| Median $/Sqft | $252 | – |
| Total $ Volume | $65,422,693 | – |
| Median Living Area Sqft | 1,894 | – |
New Pending Listings
| Median List Price | $439,900 | – |
| # of Properties | 61 | – |
| Median Days on Market | 14 | – |
| Median $/Sqft | $222 | – |
| Total $ Volume | $27,730,631 | – |
| Median Living Area Sqft | 1,952 | – |
Pending Listings
| Median List Price | $468,195 | – |
| # of Properties | 56 | – |
| Median Days on Market | 30 | – |
| Median $/Sqft | $214 | – |
| Total $ Volume | $26,310,205 | – |
| Median Living Area Sqft | 2,135 | – |
Sold Listings
| Median Sold Price | $429,250 | MoM 0.78% |
| # of Properties | 68 | – |
| Sold to List Price % | 99.36% | – |
| Median Days on Market | 13 | – |
| Median $/Sqft | $231 | – |
| Total $ Volume | $31,367,895 | – |
Months Supply of Inventory
Sold Public Records
| Median Sold Price | $405,000 | – |
| # of Properties | 25 | – |
| Median $/Sqft | $227 | – |
| Median Living Area Sqft | 1,784 | – |
| Total $ Volume | $10,461,750 | – |
Hartland, Michigan
Single-Family · RPR (Realtors Property Resource), September 2026
New Listings
| Median List Price | $339,500 | – |
| # of Properties | 9 | – |
| Median $/Sqft | $261 | – |
| Total $ Volume | $3,794,200 | – |
| Median Living Area Sqft | 1,300 | – |
Active Listings
| Median List Price | $477,400 | – |
| # of Properties | 14 | – |
| Median Days on Market | 52 | – |
| Median $/Sqft | $255 | – |
| Total $ Volume | $6,607,100 | – |
| Median Living Area Sqft | 1,827 | – |
New Pending Listings
| Median List Price | $310,000 | – |
| # of Properties | 7 | – |
| Median Days on Market | 27 | – |
| Median $/Sqft | $252 | – |
| Total $ Volume | $2,439,900 | – |
| Median Living Area Sqft | 1,232 | – |
Pending Listings
| Median List Price | $310,000 | – |
| # of Properties | 7 | – |
| Median Days on Market | – | – |
| Median $/Sqft | $240 | – |
| Total $ Volume | $2,380,800 | – |
| Median Living Area Sqft | 1,136 | – |
Sold Listings
| Median Sold Price | $288,000 | MoM 37.39% |
| # of Properties | 4 | – |
| Sold to List Price % | 96.91% | – |
| Median Days on Market | 6 | – |
| Median $/Sqft | $256 | – |
| Total $ Volume | $1,141,000 | – |
Months Supply of Inventory
Sold Public Records
There is not enough market activity at this location, for the selected property type, to display data.
Brighton, Michigan
Single-Family · RPR (Realtors Property Resource), September 2026
New Listings
| Median List Price | $549,900 | – |
| # of Properties | 63 | – |
| Median $/Sqft | $264 | – |
| Total $ Volume | $40,699,989 | – |
| Median Living Area Sqft | 2,298 | – |
Active Listings
| Median List Price | $599,900 | – |
| # of Properties | 83 | – |
| Median Days on Market | 34 | – |
| Median $/Sqft | $258 | – |
| Total $ Volume | $58,526,362 | – |
| Median Living Area Sqft | 2,304 | – |
New Pending Listings
| Median List Price | $512,500 | – |
| # of Properties | 38 | – |
| Median Days on Market | 29 | – |
| Median $/Sqft | $255 | – |
| Total $ Volume | $23,694,700 | – |
| Median Living Area Sqft | 2,112 | – |
Pending Listings
| Median List Price | $532,000 | – |
| # of Properties | 36 | – |
| Median Days on Market | 6 | – |
| Median $/Sqft | $254 | – |
| Total $ Volume | $22,831,950 | – |
| Median Living Area Sqft | 2,294 | – |
Sold Listings
| Median Sold Price | $532,450 | MoM 7.57% |
| # of Properties | 60 | – |
| Sold to List Price % | 100.22% | – |
| Median Days on Market | 13 | – |
| Median $/Sqft | $253 | – |
| Total $ Volume | $37,410,355 | – |
Months Supply of Inventory
Sold Public Records
| Median Sold Price | $448,500 | – |
| # of Properties | 23 | – |
| Median $/Sqft | $242 | – |
| Median Living Area Sqft | 1,872 | – |
| Total $ Volume | $12,826,870 | – |
Pinckney, Michigan
Single-Family · RPR (Realtors Property Resource), September 2026
New Listings
| Median List Price | $458,500 | – |
| # of Properties | 26 | – |
| Median $/Sqft | $234 | – |
| Total $ Volume | $12,682,098 | – |
| Median Living Area Sqft | 1,642 | – |
Active Listings
| Median List Price | $549,990 | – |
| # of Properties | 57 | – |
| Median Days on Market | 55 | – |
| Median $/Sqft | $249 | – |
| Total $ Volume | $32,672,587 | – |
| Median Living Area Sqft | 2,000 | – |
New Pending Listings
| Median List Price | $422,400 | – |
| # of Properties | 20 | – |
| Median Days on Market | 30 | – |
| Median $/Sqft | $240 | – |
| Total $ Volume | $10,427,300 | – |
| Median Living Area Sqft | 1,960 | – |
Pending Listings
| Median List Price | $424,900 | – |
| # of Properties | 17 | – |
| Median Days on Market | 22 | – |
| Median $/Sqft | $225 | – |
| Total $ Volume | $8,035,399 | – |
| Median Living Area Sqft | 2,087 | – |
Sold Listings
| Median Sold Price | $450,000 | MoM 3.45% |
| # of Properties | 23 | – |
| Sold to List Price % | 99.18% | – |
| Median Days on Market | 19 | – |
| Median $/Sqft | $261 | – |
| Total $ Volume | $11,718,346 | – |
Months Supply of Inventory
Sold Public Records
| Median Sold Price | $520,000 | – |
| # of Properties | 5 | – |
| Median $/Sqft | $418 | – |
| Median Living Area Sqft | 2,016 | – |
| Total $ Volume | $3,255,845 | – |
Whitmore Lake, Michigan
Single-Family · RPR (Realtors Property Resource), September 2026
New Listings
| Median List Price | $397,500 | MoM 16.1% |
| # of Properties | 12 | MoM 33.3% |
| Median $/Sqft | $261 | MoM 18.1% |
| Total $ Volume | $5,175,500 | MoM 24.5% |
| Median Living Area Sqft | 1,484 | MoM 12.2% |
Active Listings
| Median List Price | $499,900 | MoM 8.7% |
| # of Properties | 19 | MoM 9.5% |
| Median Days on Market | 47 | MoM 2.2% |
| Median $/Sqft | $257 | MoM 8.5% |
| Total $ Volume | $8,715,200 | MoM 11.4% |
| Median Living Area Sqft | 1,572 | MoM 0% |
New Pending Listings
| Median List Price | $340,000 | MoM 26.1% |
| # of Properties | 7 | MoM 58.8% |
| Median Days on Market | 61 | MoM 335.7% |
| Median $/Sqft | $283 | MoM 22% |
| Total $ Volume | $2,983,799 | MoM 60.8% |
| Median Living Area Sqft | 1,630 | MoM 10.1% |
Pending Listings
| Median List Price | $459,949 | MoM 5.2% |
| # of Properties | 6 | MoM 60% |
| Median Days on Market | 18 | MoM 28.6% |
| Median $/Sqft | $252 | MoM 8.6% |
| Total $ Volume | $2,598,306 | MoM 63.8% |
| Median Living Area Sqft | 1,753 | MoM 12.4% |
Sold Listings
| Median Sold Price | $450,000 | MoM 7.4% |
| # of Properties | 17 | MoM 15% |
| Sold to List Price % | 98.59% | MoM 0.1% |
| Median Days on Market | 14 | MoM 16.7% |
| Median $/Sqft | $232 | MoM 7.6% |
| Total $ Volume | $7,771,985 | MoM 11.3% |
Months Supply of Inventory
Sold Public Records
| Median Sold Price | $388,500 | MoM 10.7% |
| # of Properties | 4 | MoM 81% |
| Median $/Sqft | $336 | MoM 16.3% |
| Median Living Area Sqft | 1,440 | MoM 20.5% |
| Total $ Volume | $1,597,000 | MoM 83% |
Township-level figures below were researched in October 2026 from public sources including Homes.com, Redfin, RealtyTrac, and local MLS reports; each figure is labeled with its source and data period. Where a public provider does not publish a metric for a township, it is noted as "Not available."
| Community | Median Sales Price | Median DOM | Months of Inventory | Data Period / Source |
|---|---|---|---|---|
| Hamburg Township | $295,000 (est. value) | Insufficient data | Insufficient data | Sep 2026 · RPR: insufficient market activity; median estimated value $295,000 |
| Genoa Township | $445,000† | 40 days | Not available | 12 mo · Homes.com† (DOM per Homes.com) |
| Green Oak Township | $490,000 | 19 days | Not available | Oct 2025 · Redfin (ZIP 48178) |
| Marion Township | $558,400† | Not available | Not available | 12 mo · Homes.com† |
| Cohoctah Township | $429,900 | 48 days | 2.4 months | 12 mo · Homes.com (SFR) |
| Handy Township | Not available | Not available | Not available | — public SFR metrics not published |
| Iosco Township | $326,794 | Not available | Not available | 12 mo · RealtyTrac (ZIP 48836 proxy) |
| Tyrone Township | $465,000 | Not available | Not available | 12 mo · Homes.com (SFR median) |
| Oceola Township | $430,000 | 27 days | Not available | 12 mo · Homes.com (SFR median) |
| Putnam Township | $445,000 | 47 days | 3.3 months | 12 mo · Homes.com (SFR) |
| Unadilla Township | $342,000 | 21 days | 2.4 months | 12 mo · Homes.com (SFR) |
† All-home-type median reported by the cited provider; a single-family-only median was not published for that community. ZIP-level figures cover the ZIP's predominantly single-family market; the cited provider does not publish a separate single-family breakout. Not available = the specific single-family metric was not published by major public data providers for this community as of October 2026. Days on market figures reflect the median where the cited provider reports a median; providers use different methodologies and periods, so figures vary by source.
Notes: Detailed listing-activity tables, sold public records, months-of-inventory figures, and headline market figures above are Realtors Property Resource (RPR), LLC data for single-family properties in September 2026. The township-level table below retains the cited public sources (Homes.com, Redfin, RealtyTrac, and local MLS reports). “Not available” or “insufficient data” indicates the metric was not published by the cited provider for this community as of this update.
What Are the Communities in Livingston County?
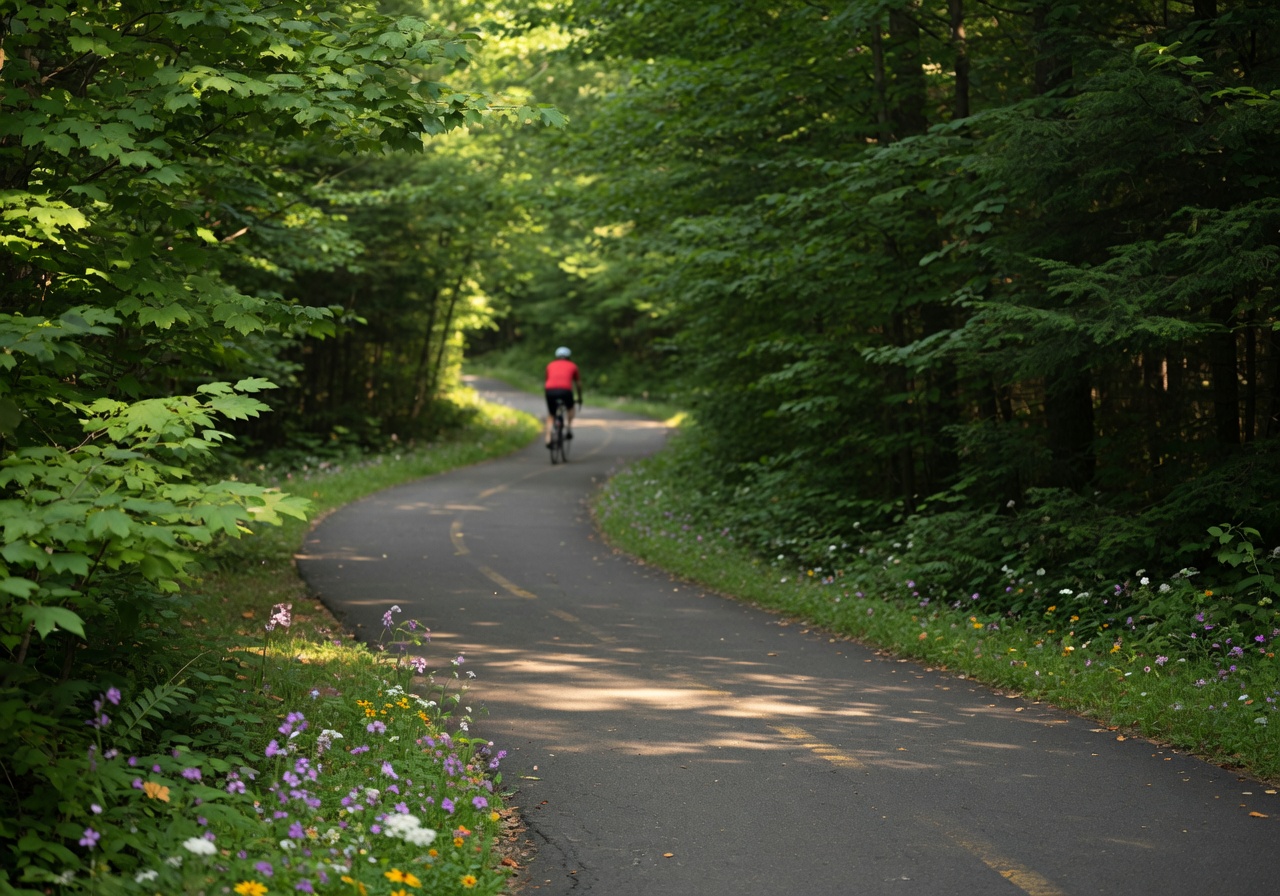
Brighton
A city with a walkable downtown and easy access to I-96 and US-23.
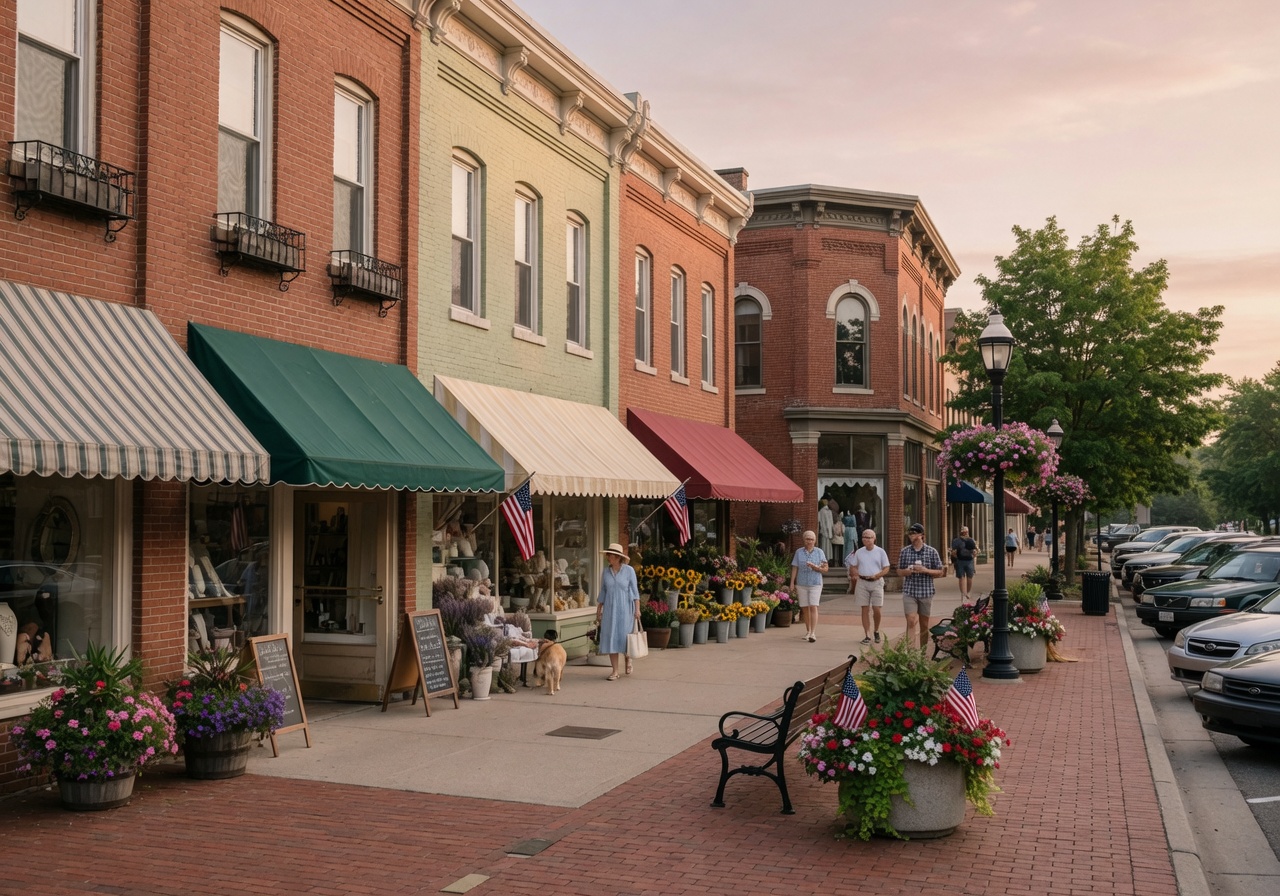
Howell
The county seat with a historic downtown, community traditions, and local events.
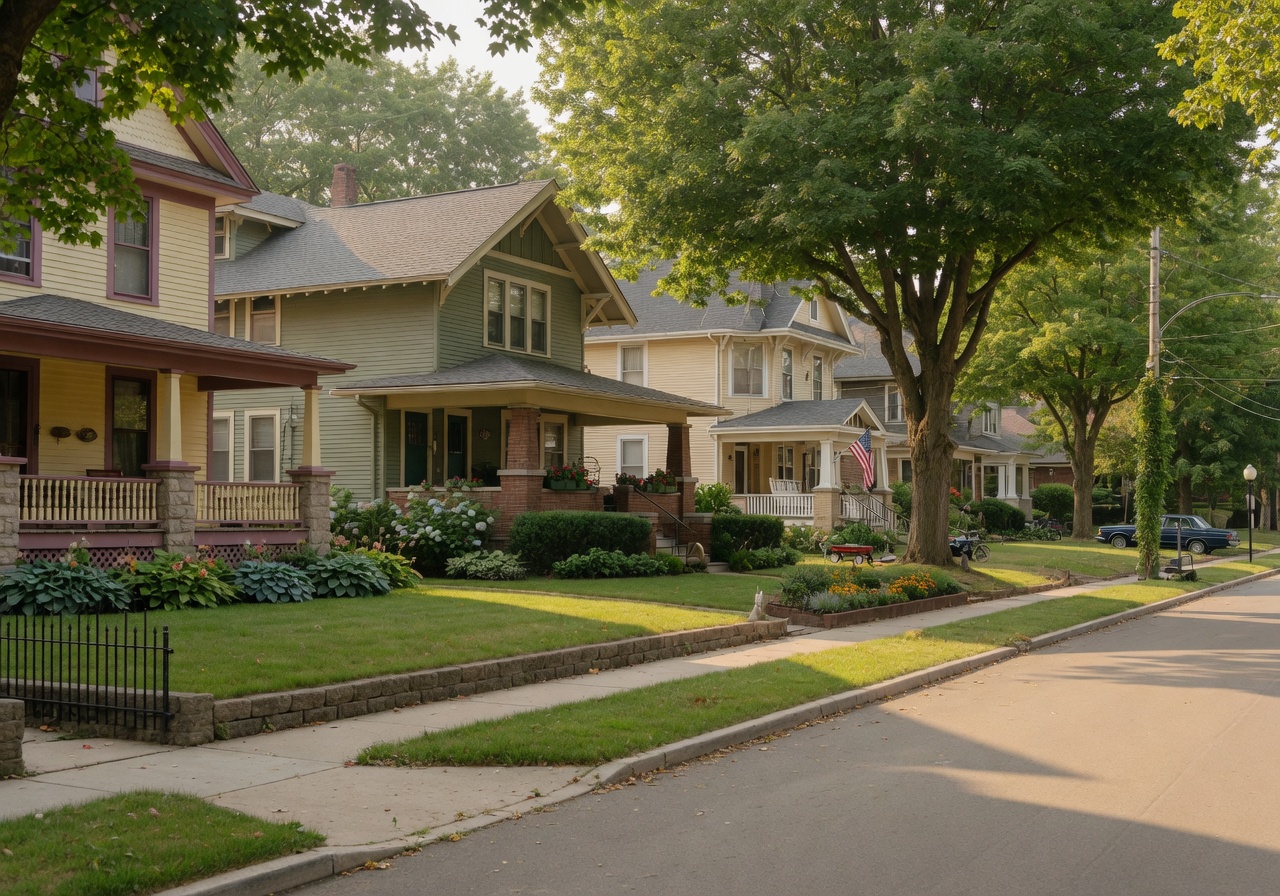
Hartland
Schools, accessible dining and entertainment, and a residential community layout.
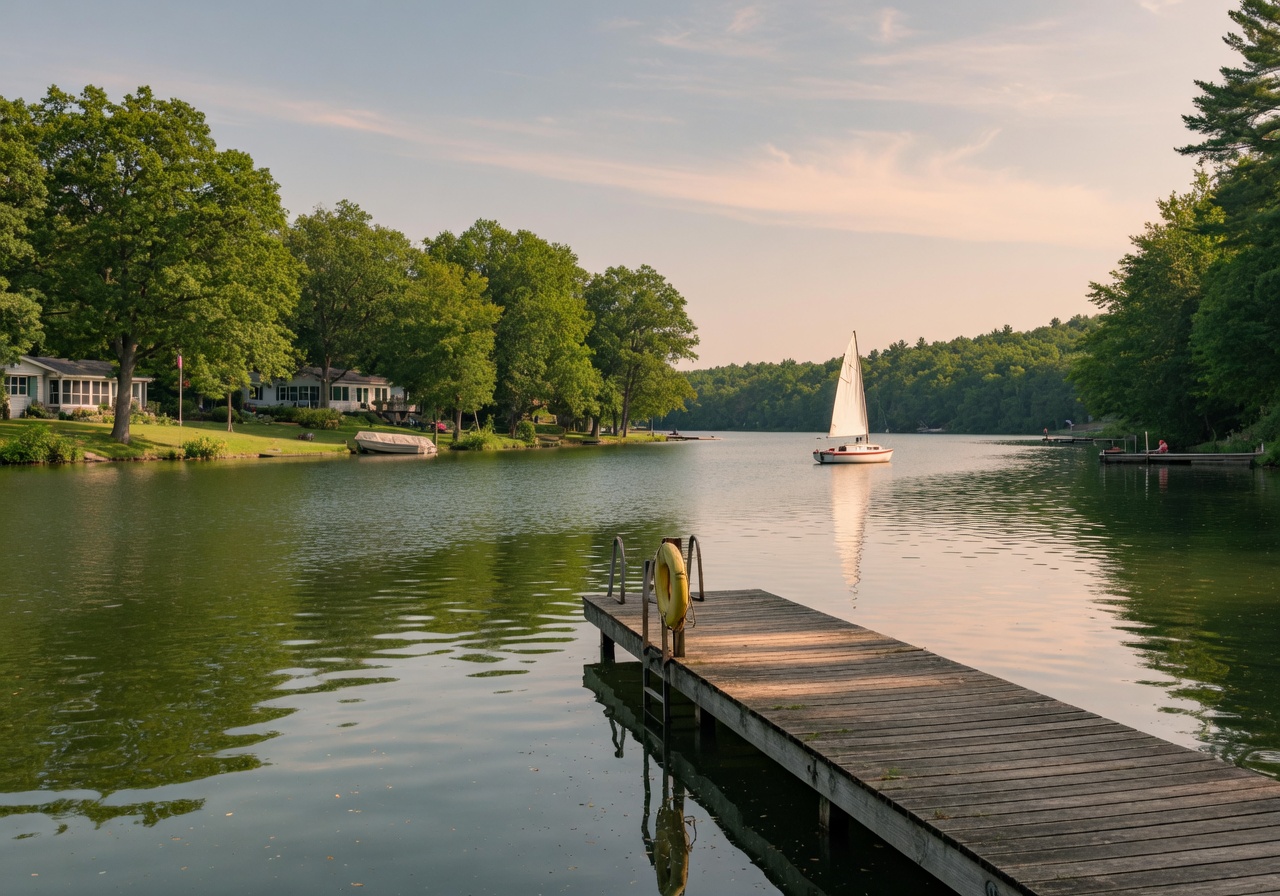
Hamburg Township
Extensive lake systems, a rural atmosphere, and waterfront living in the central part of the county.
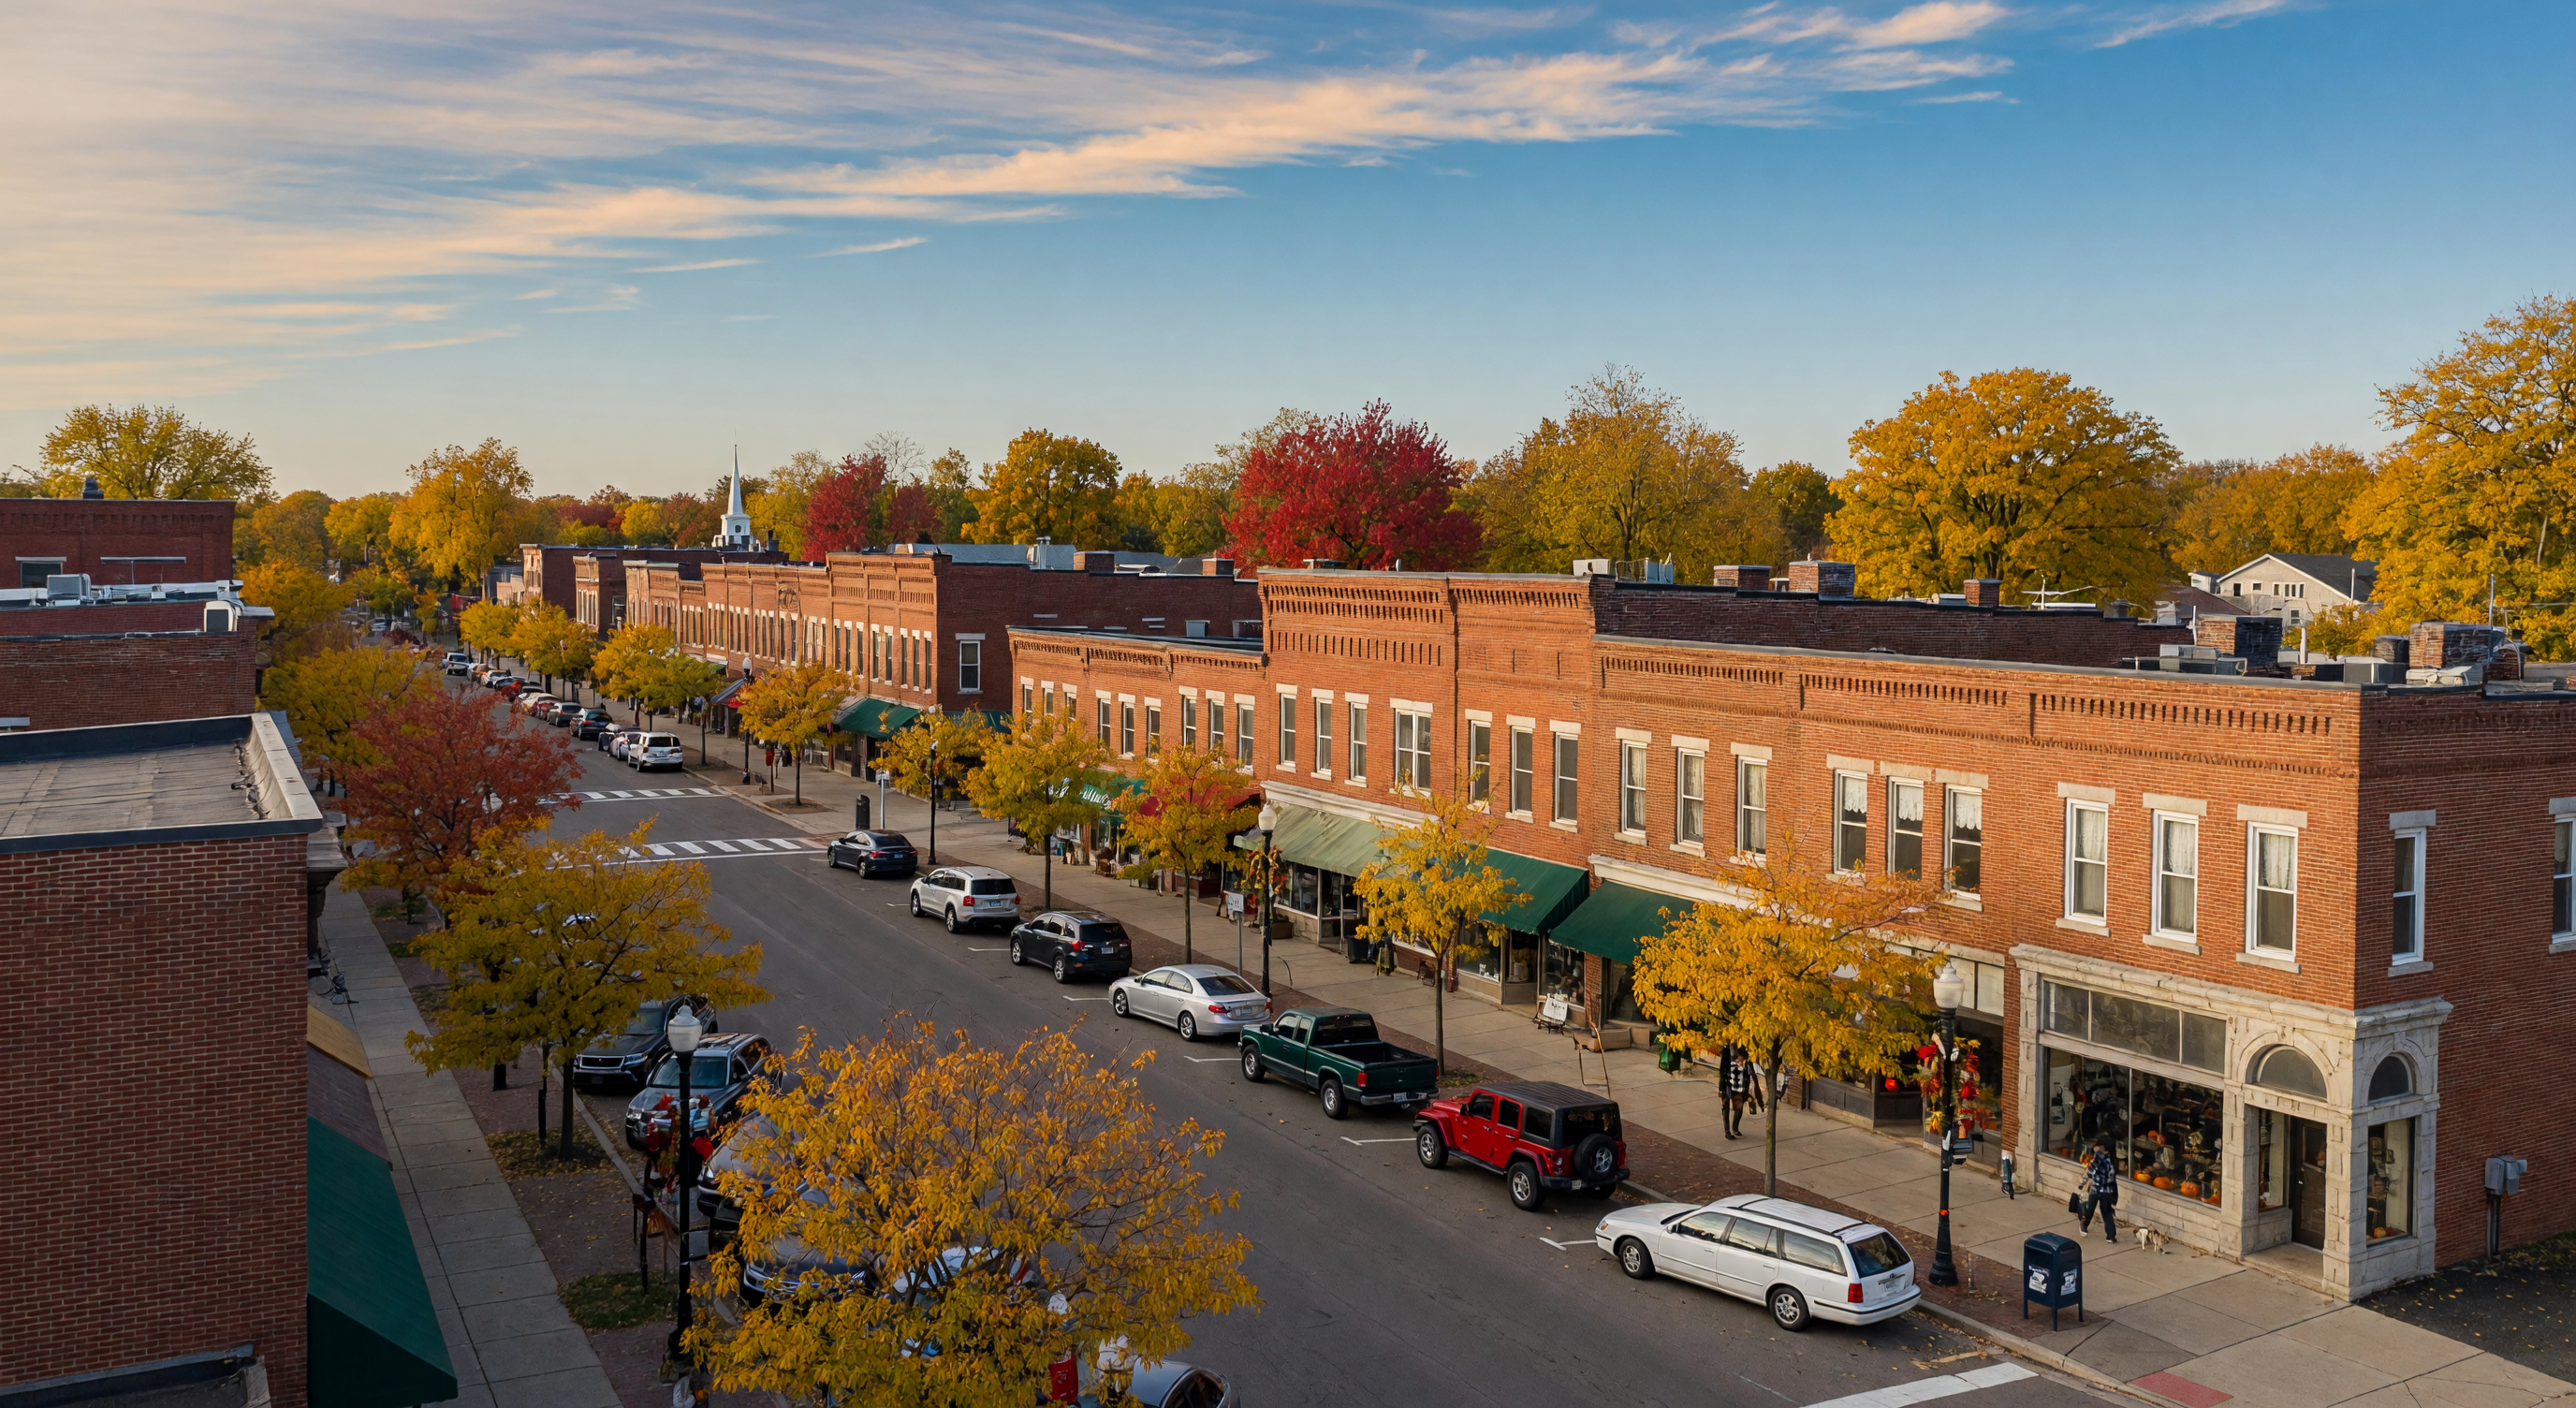
Pinckney
A community surrounded by the Pinckney Recreation Area and the Chain of Lakes.
Fowlerville
A rural village with a central downtown and convenient access to I-96 and US-23.
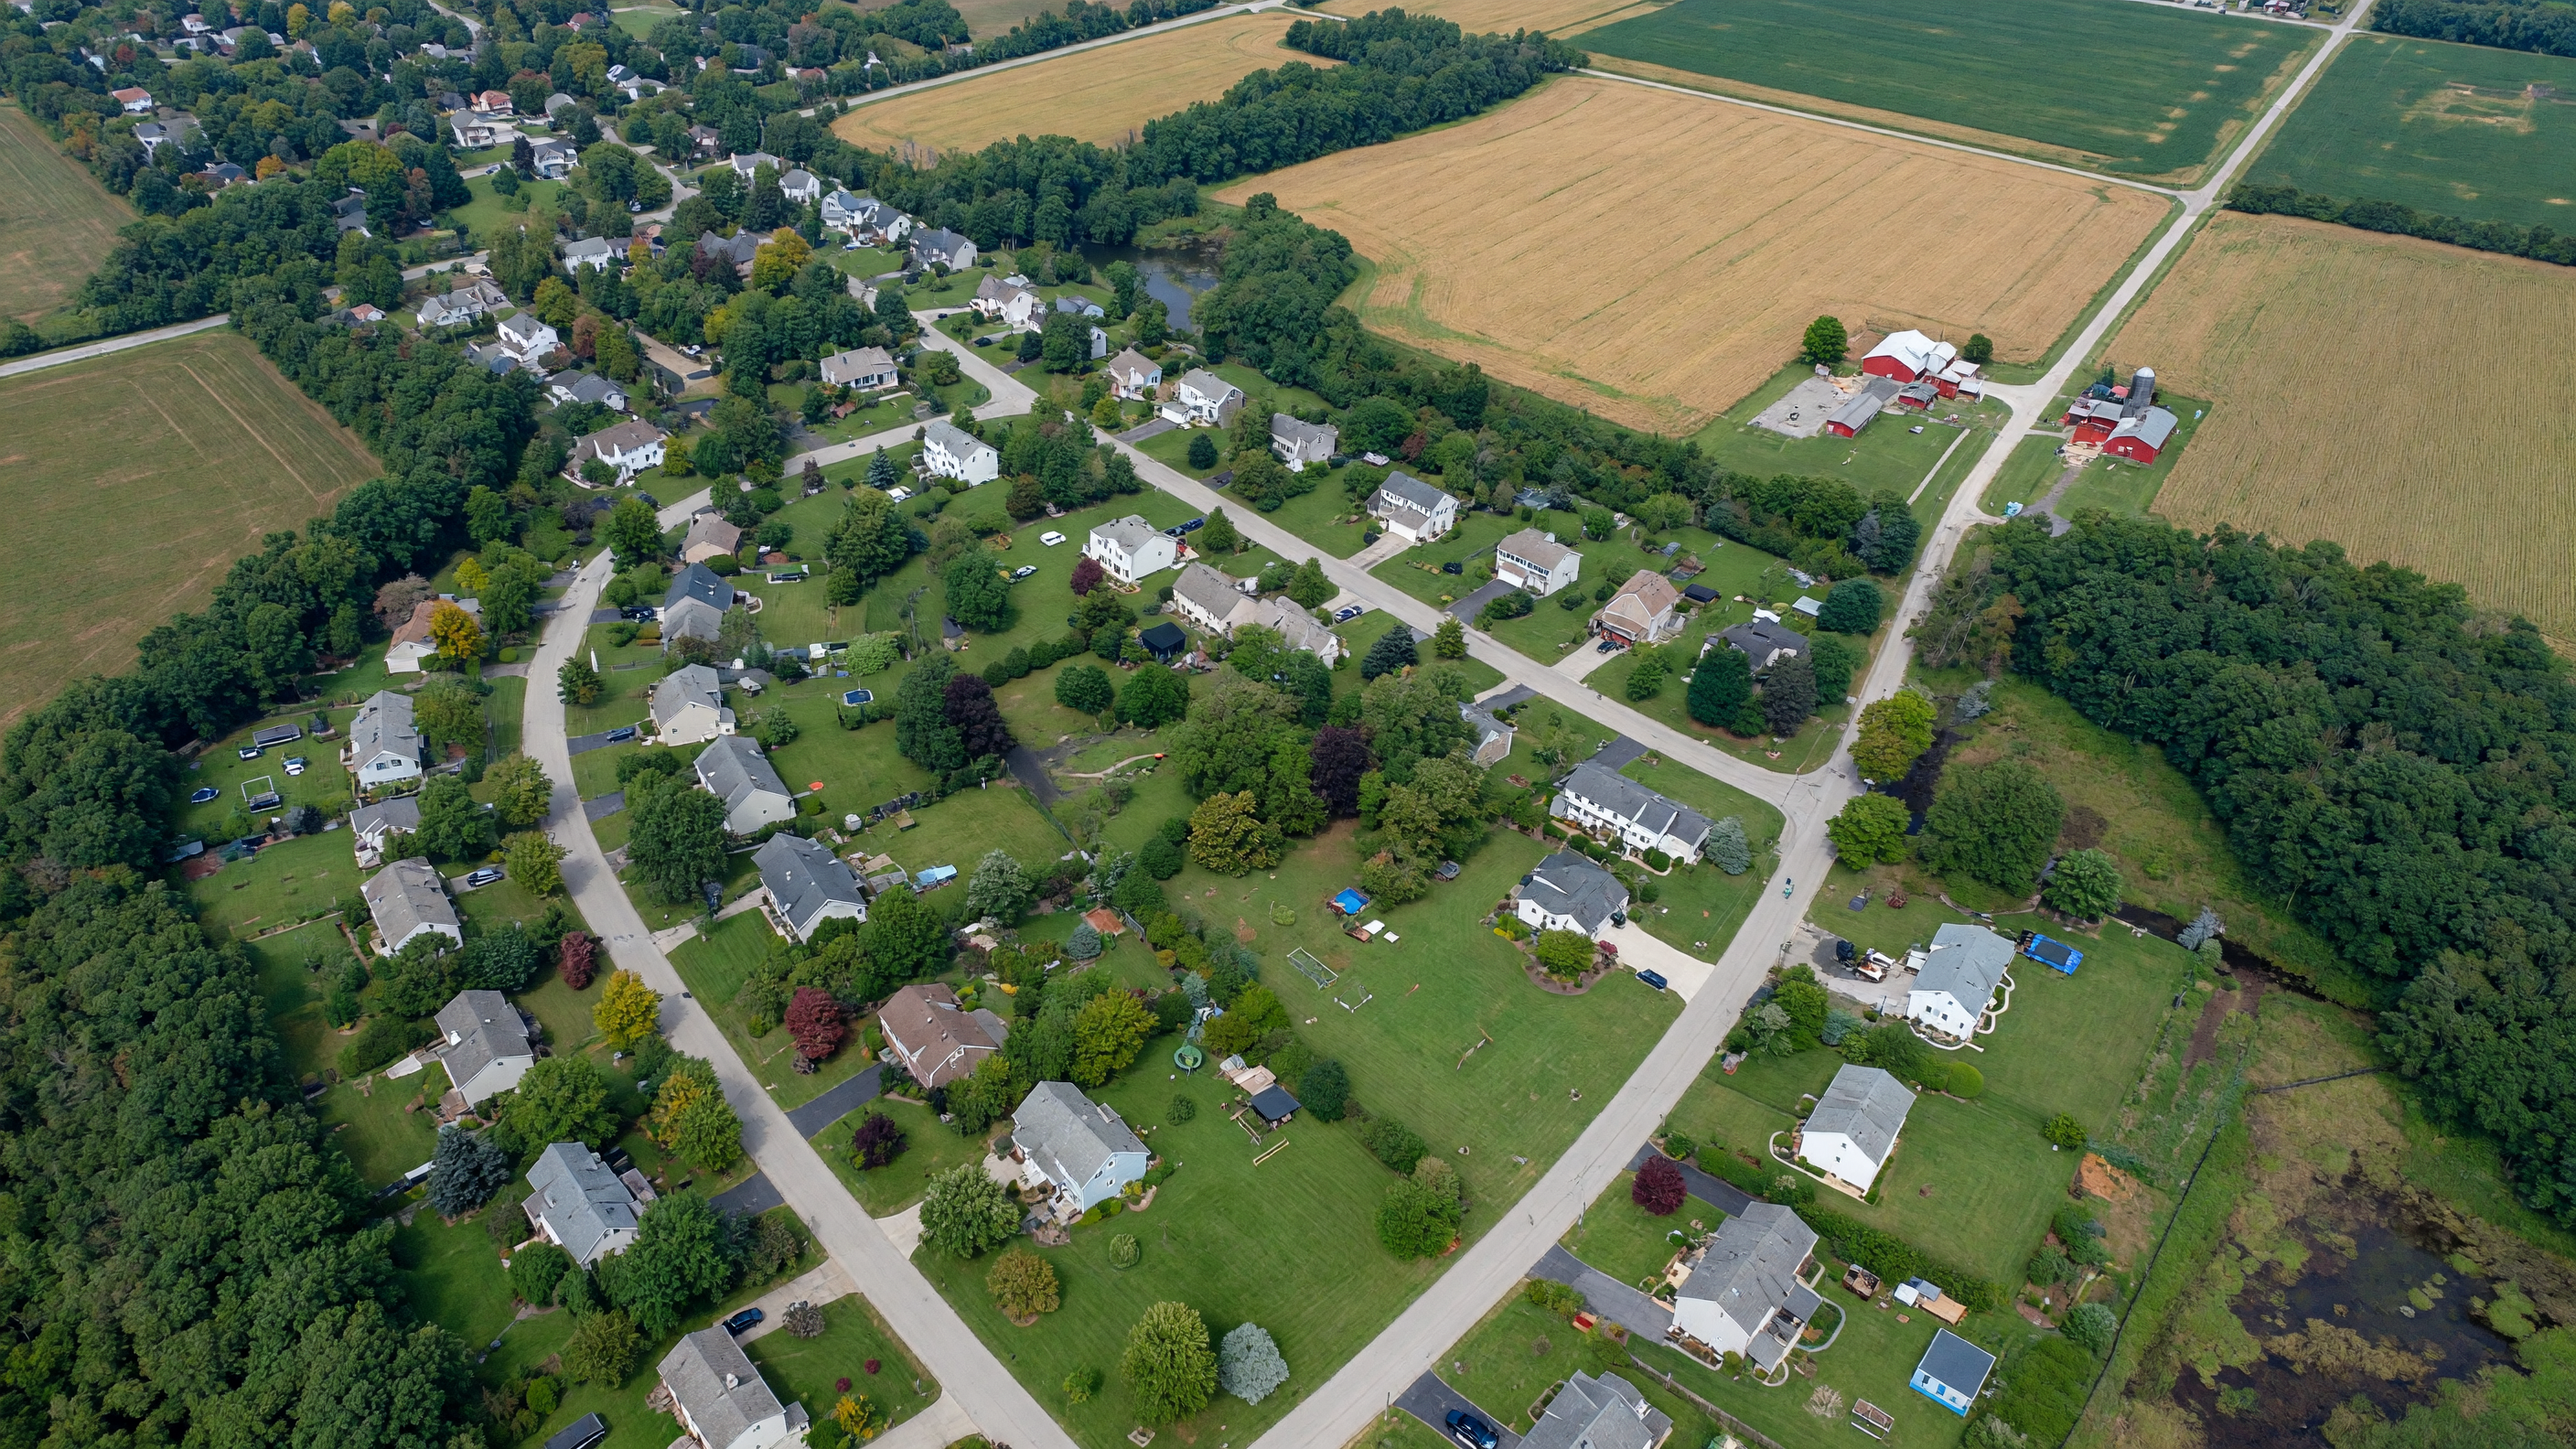
Genoa Township
Brighton Area Schools, neighborhoods with a mix of home types, and easy access to Island Lake Recreation Area.
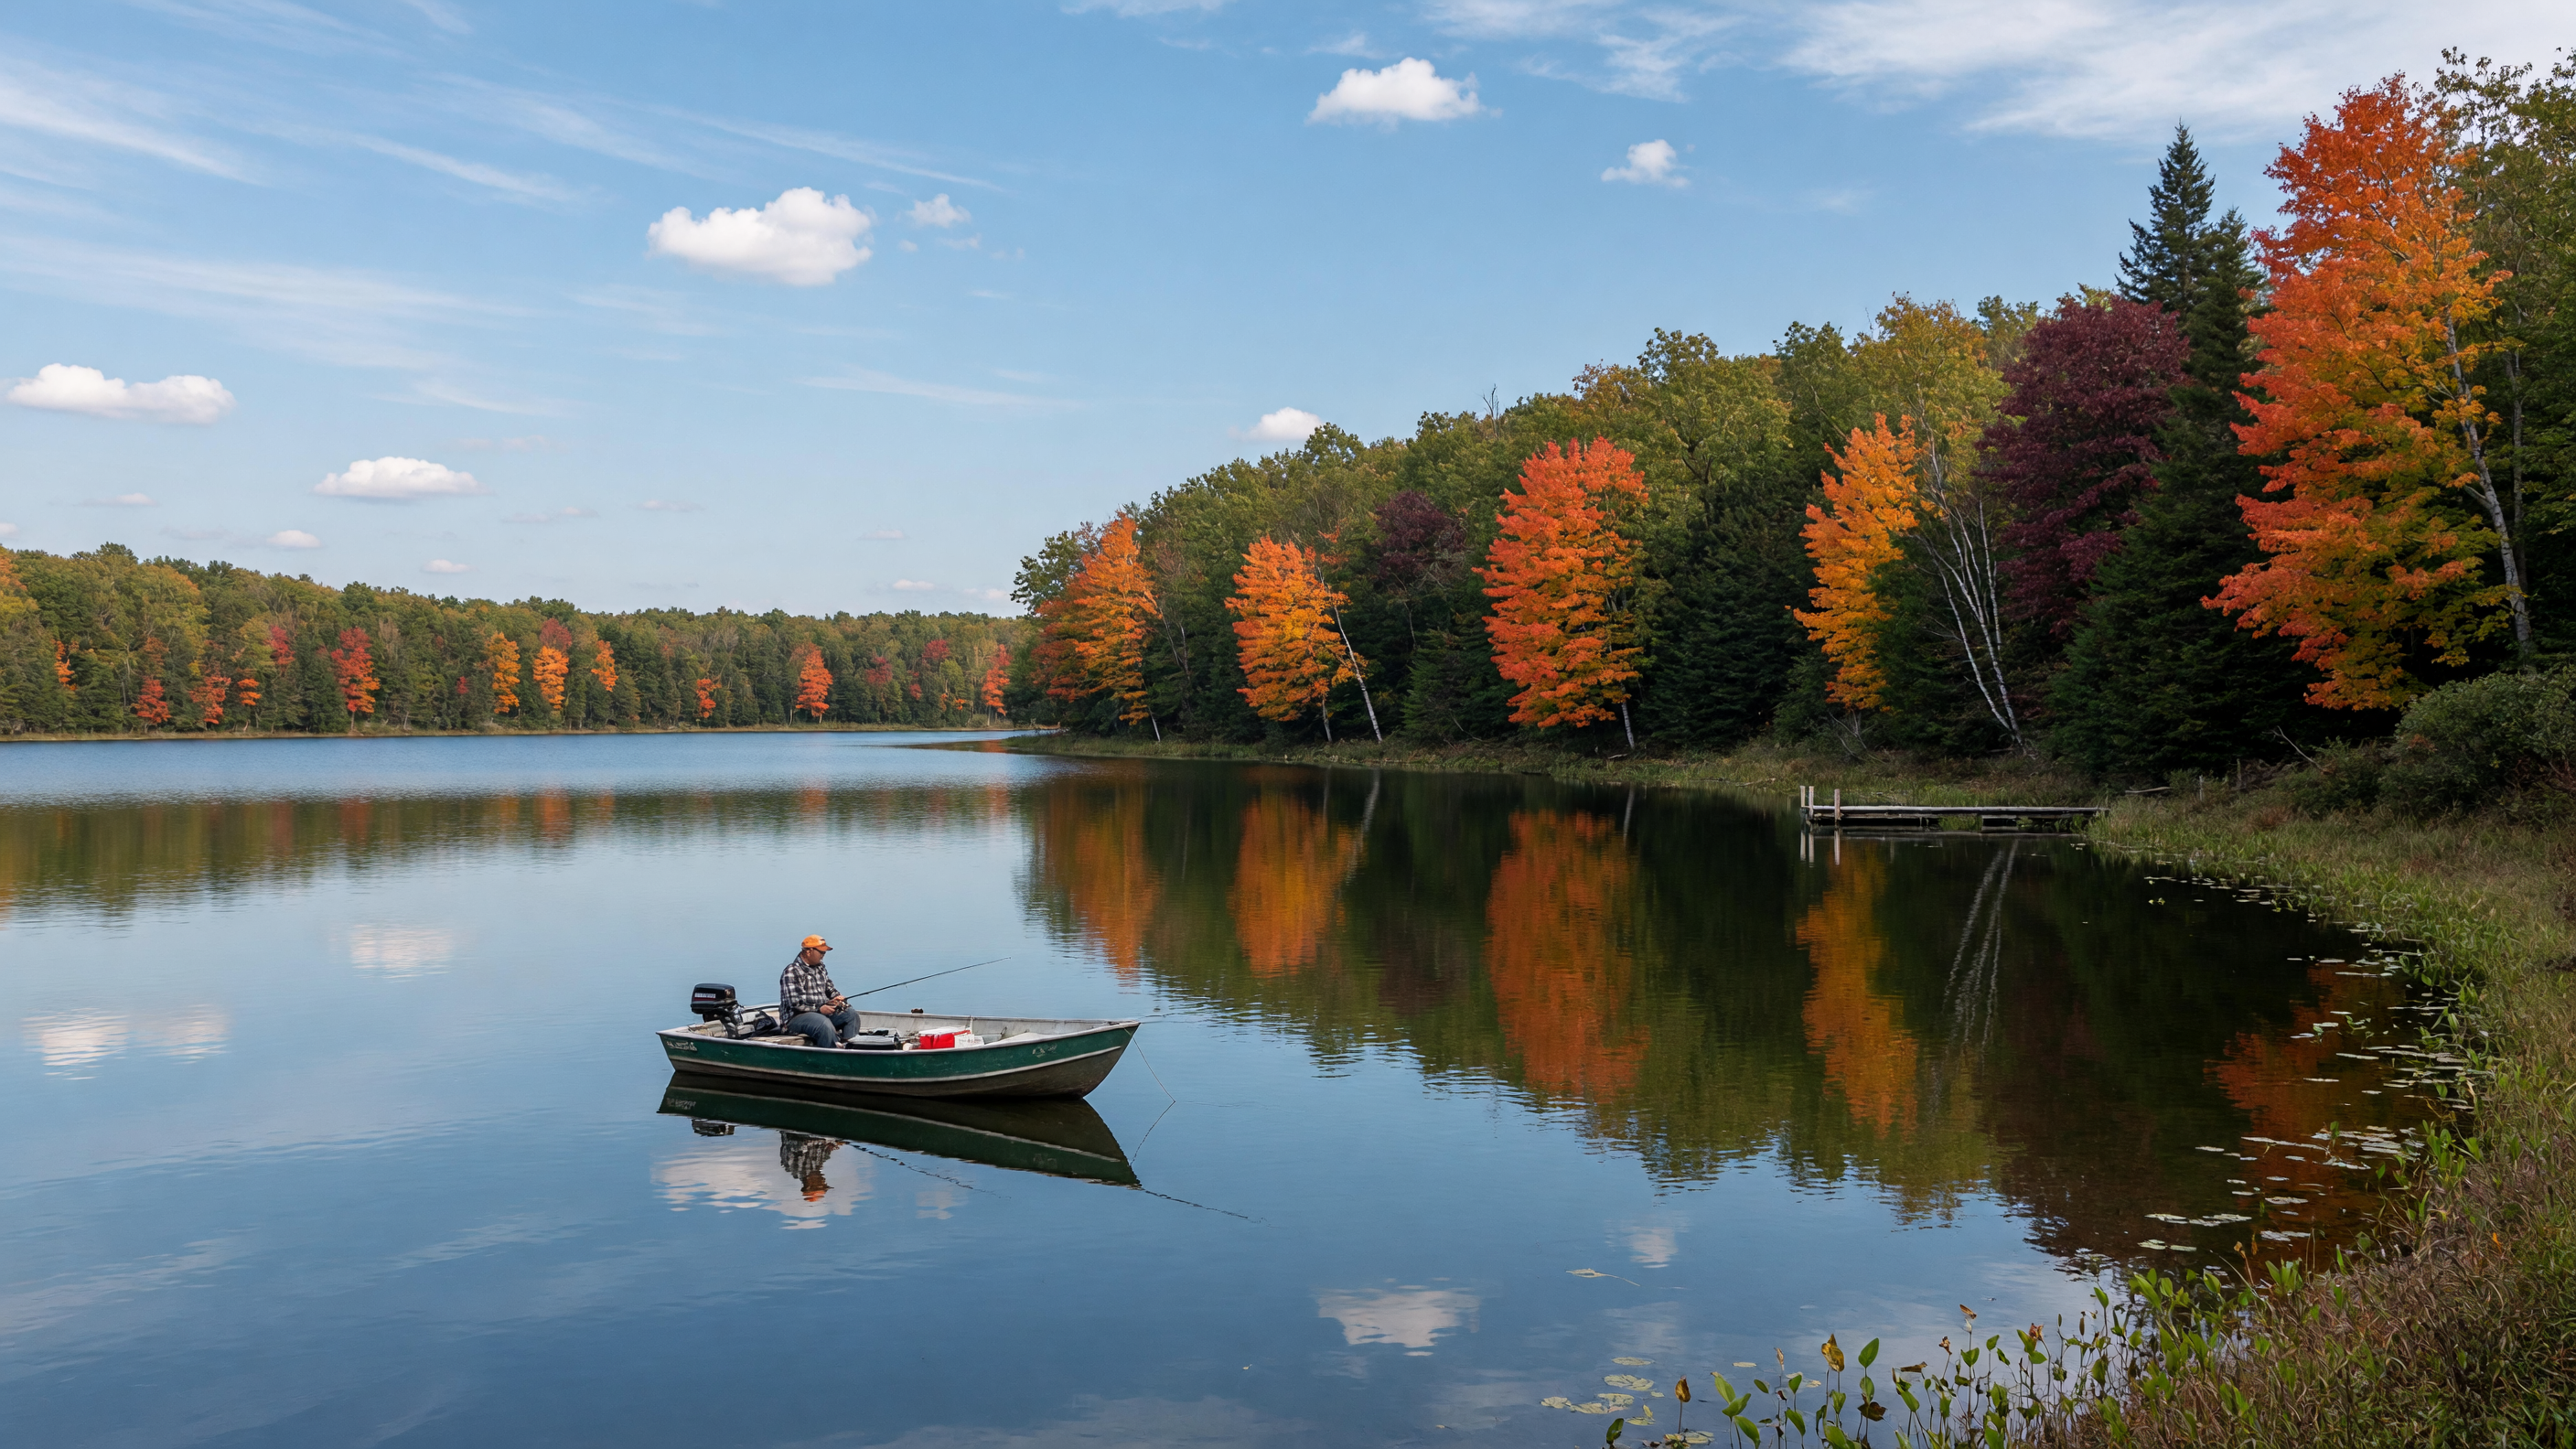
Oceola Township
A suburban-rural blend with Thompson Lake, farmland, and convenient access to Howell and Brighton.
Marion Township
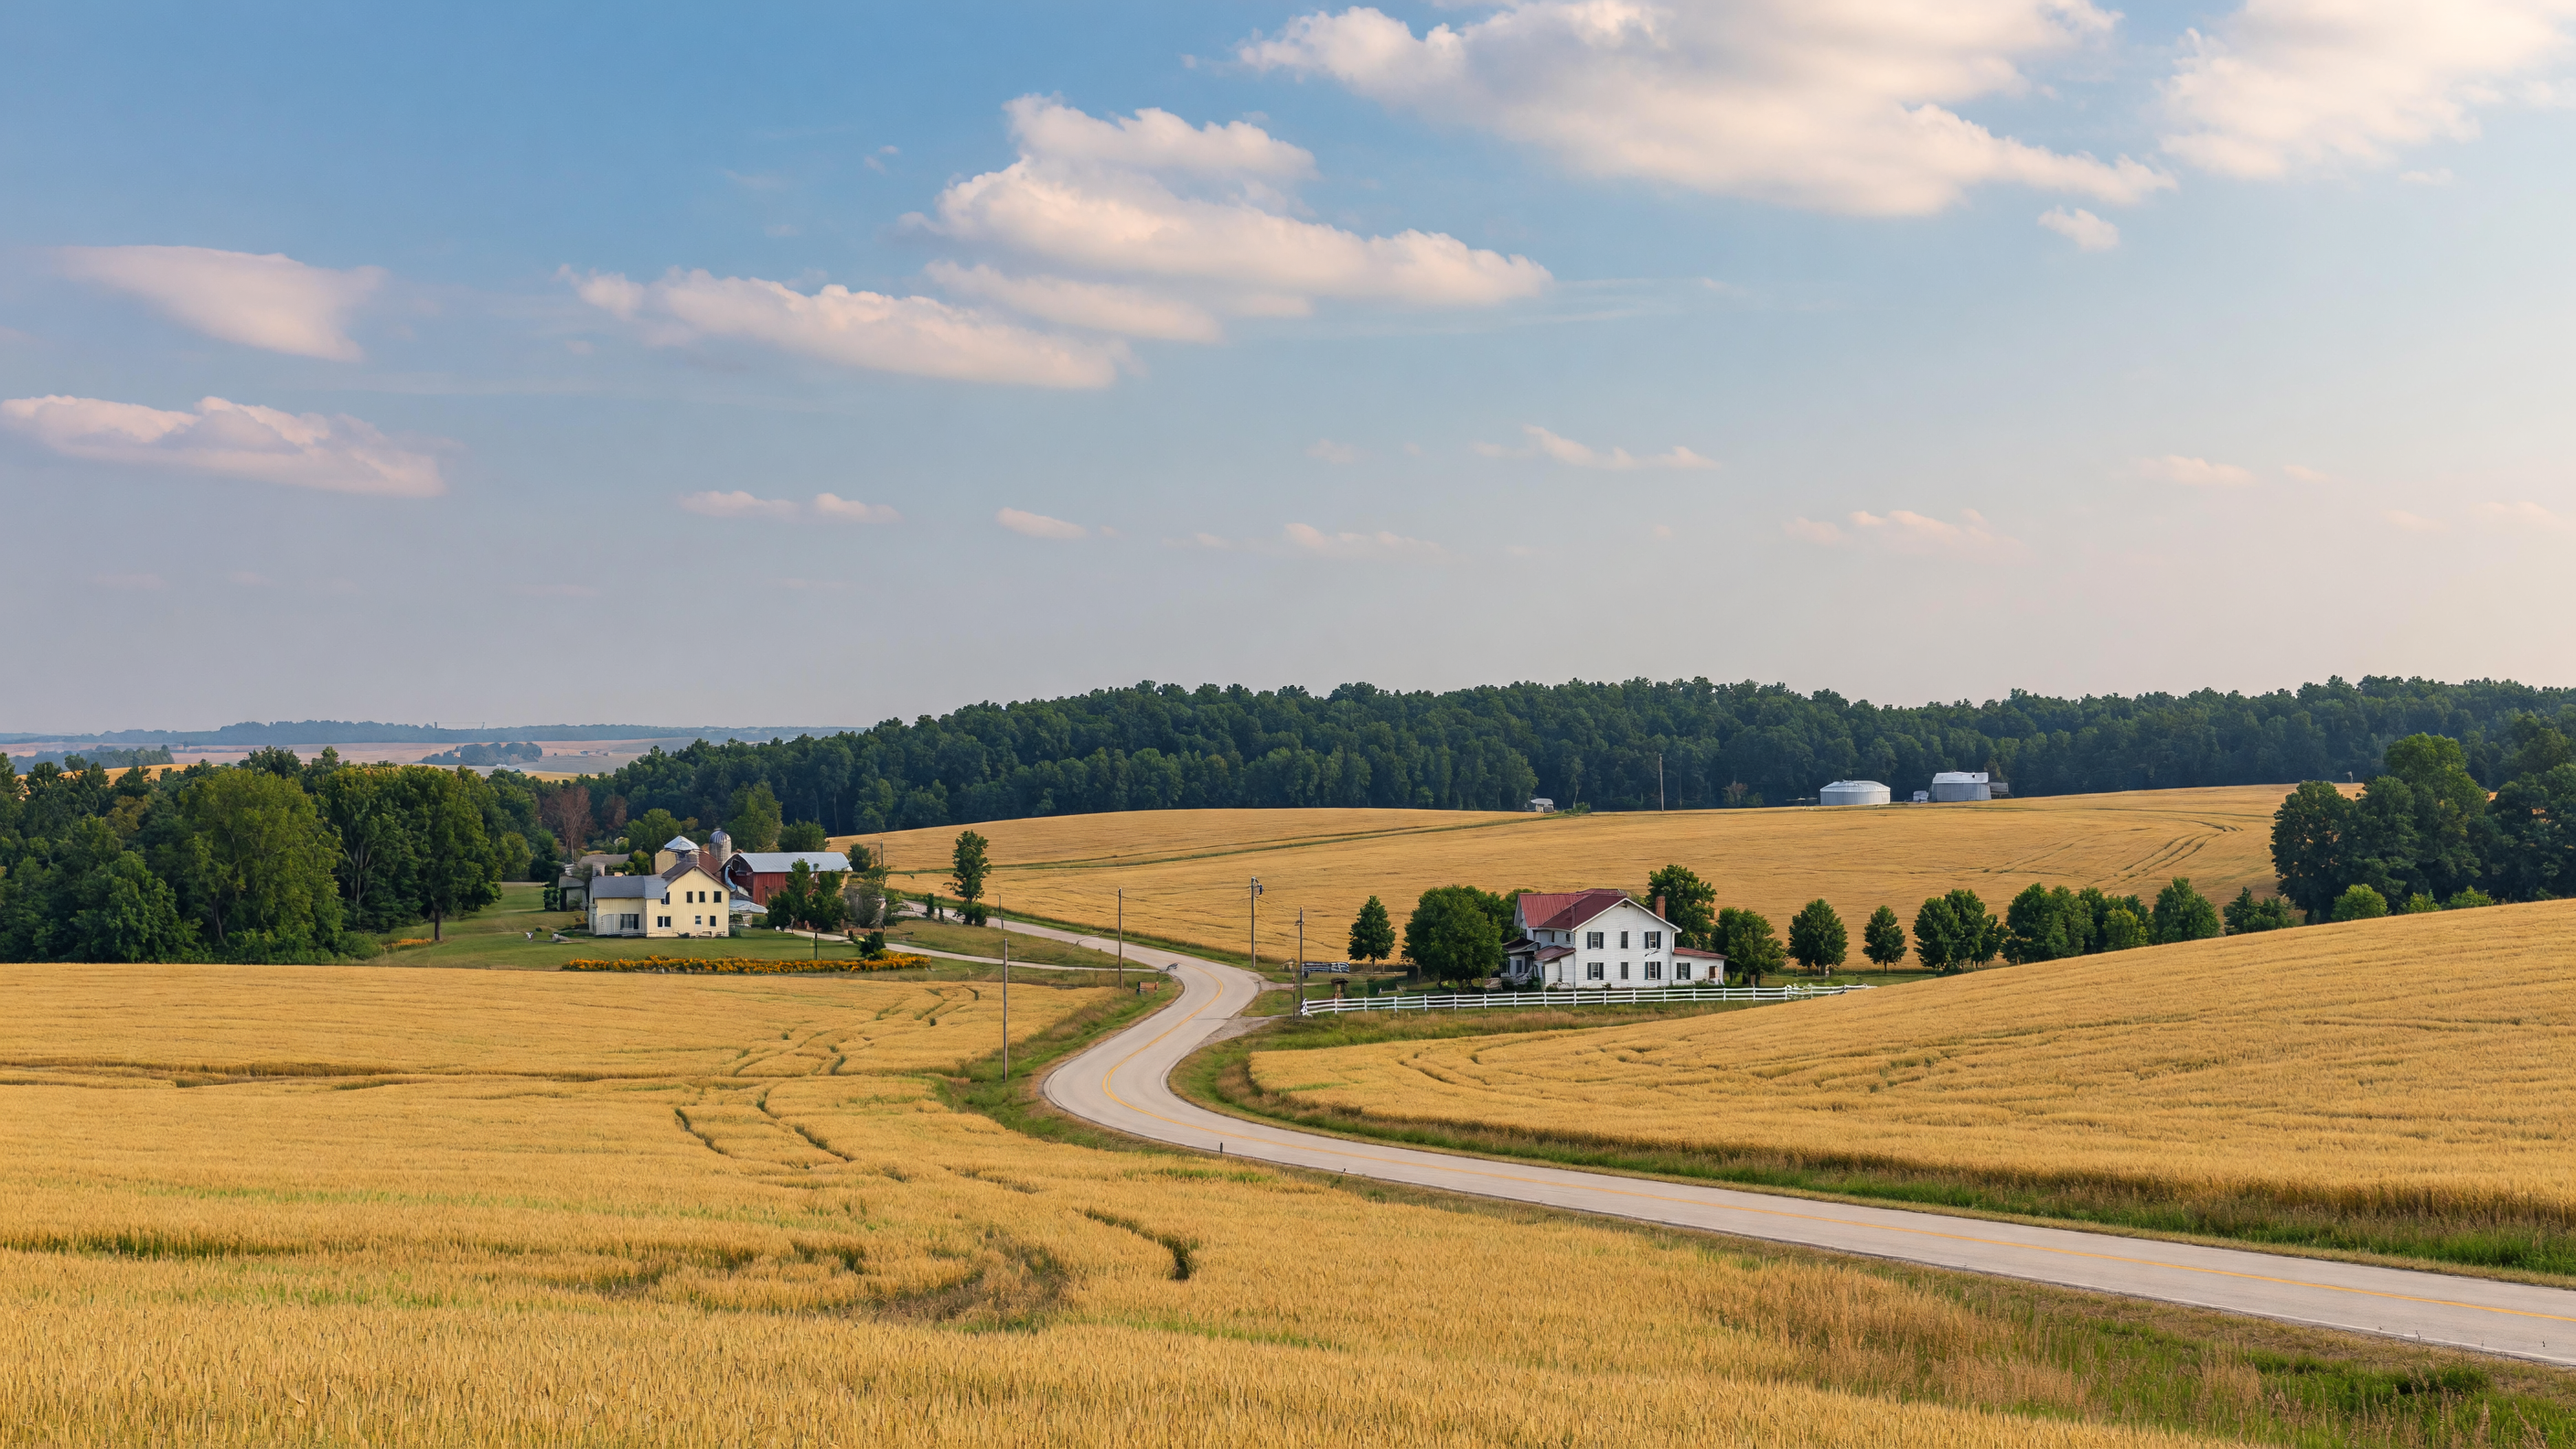
A rural township with lakes, spacious properties, and residential neighborhoods near Howell and Fowlerville.
Tyrone Township
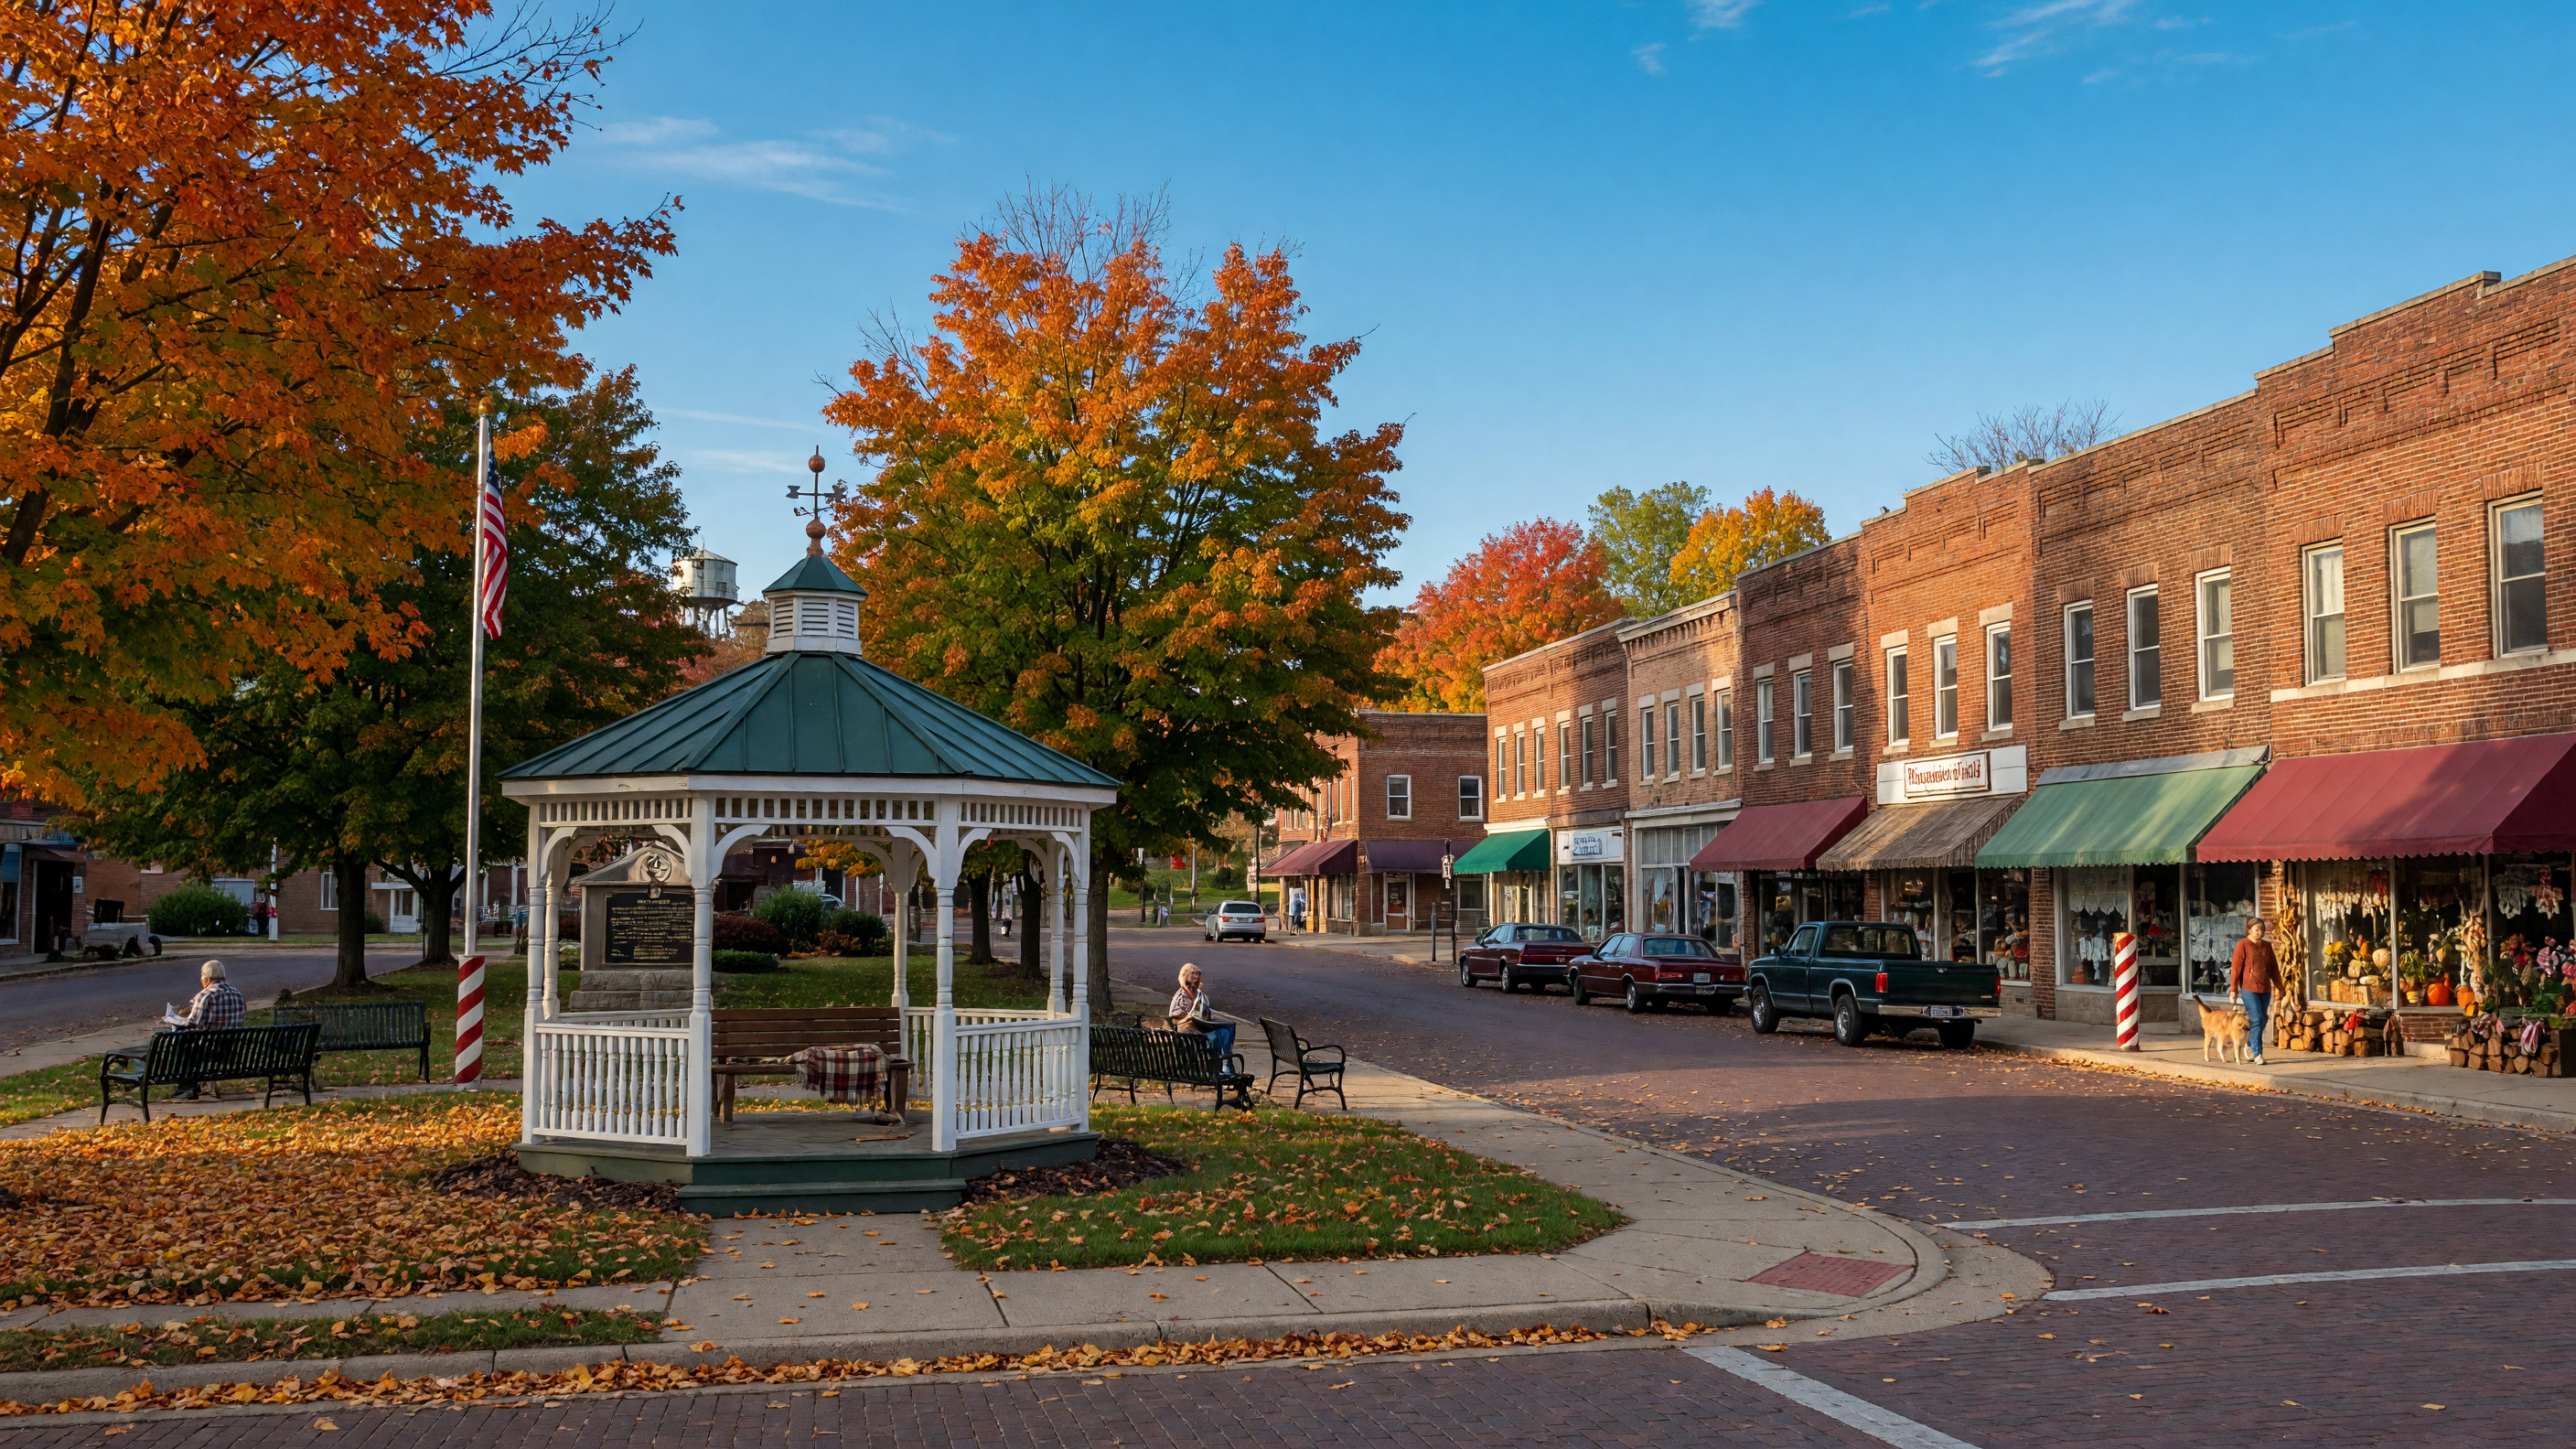
A rural community with private lakes, spacious lots, and proximity to Fenton and Hartland.
Milford
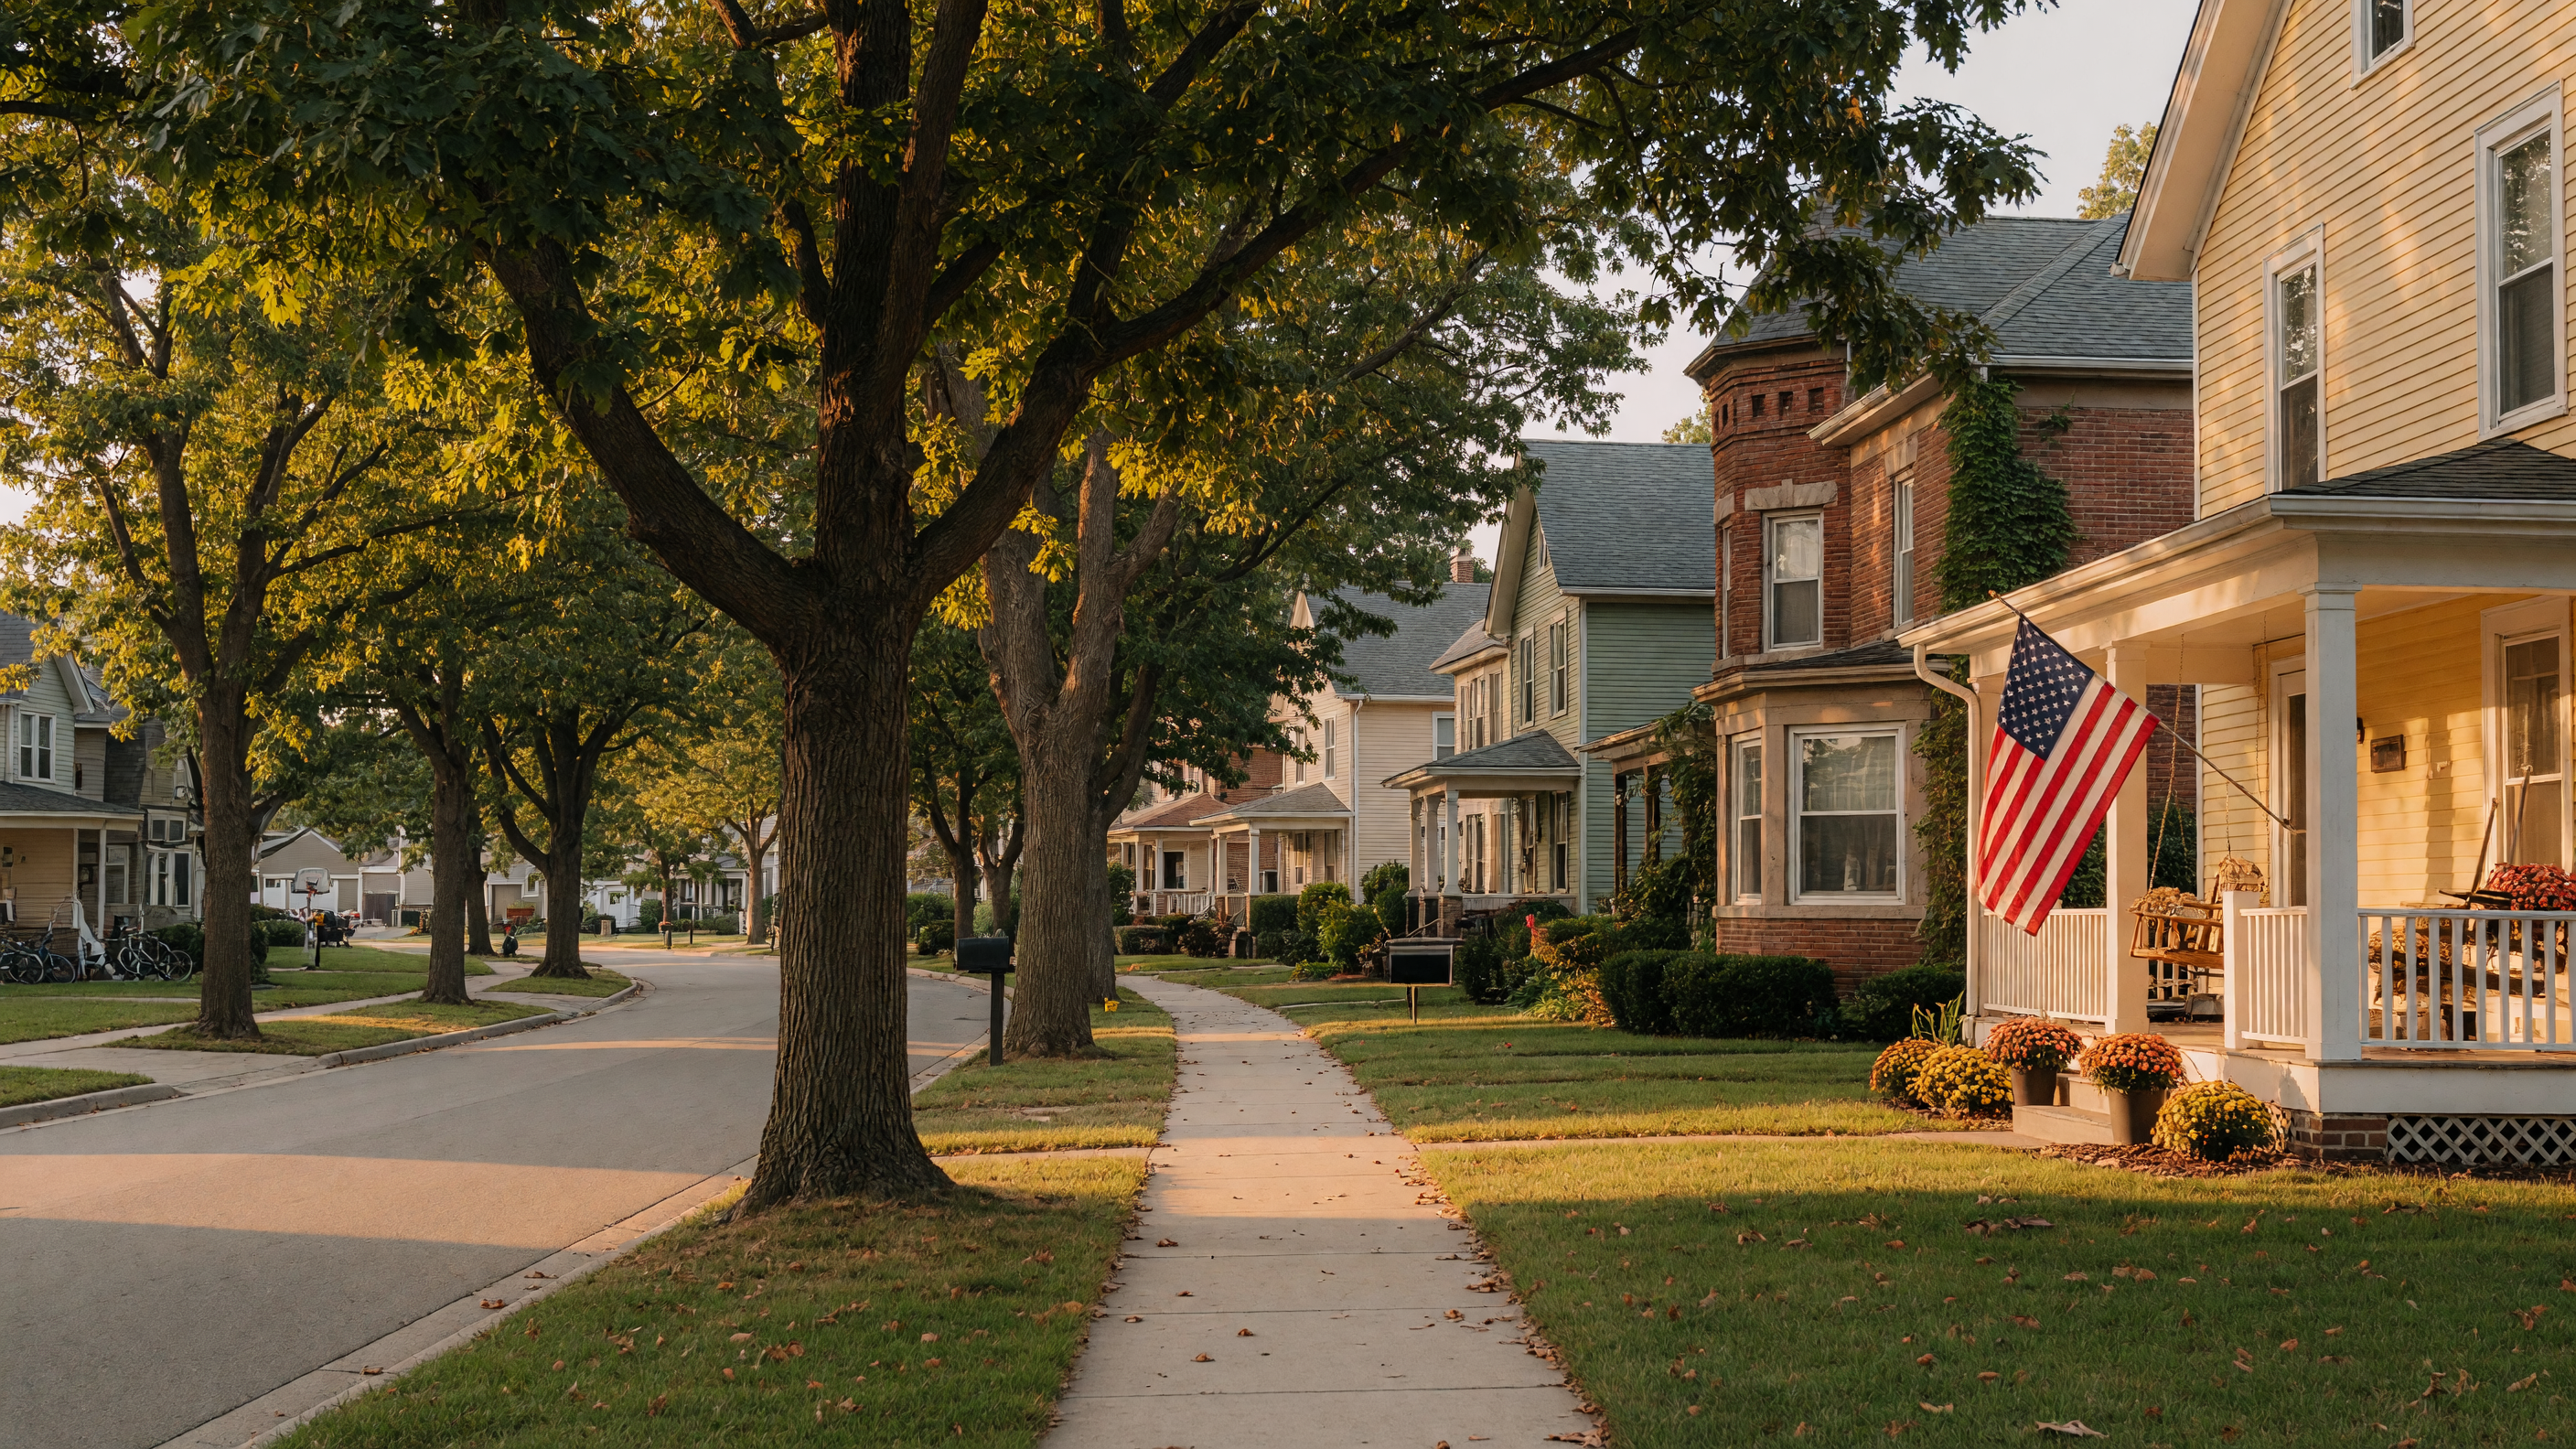
A walkable village with a downtown, Huron River access, and Kensington Metropark at the Oakland–Livingston border.
Fenton
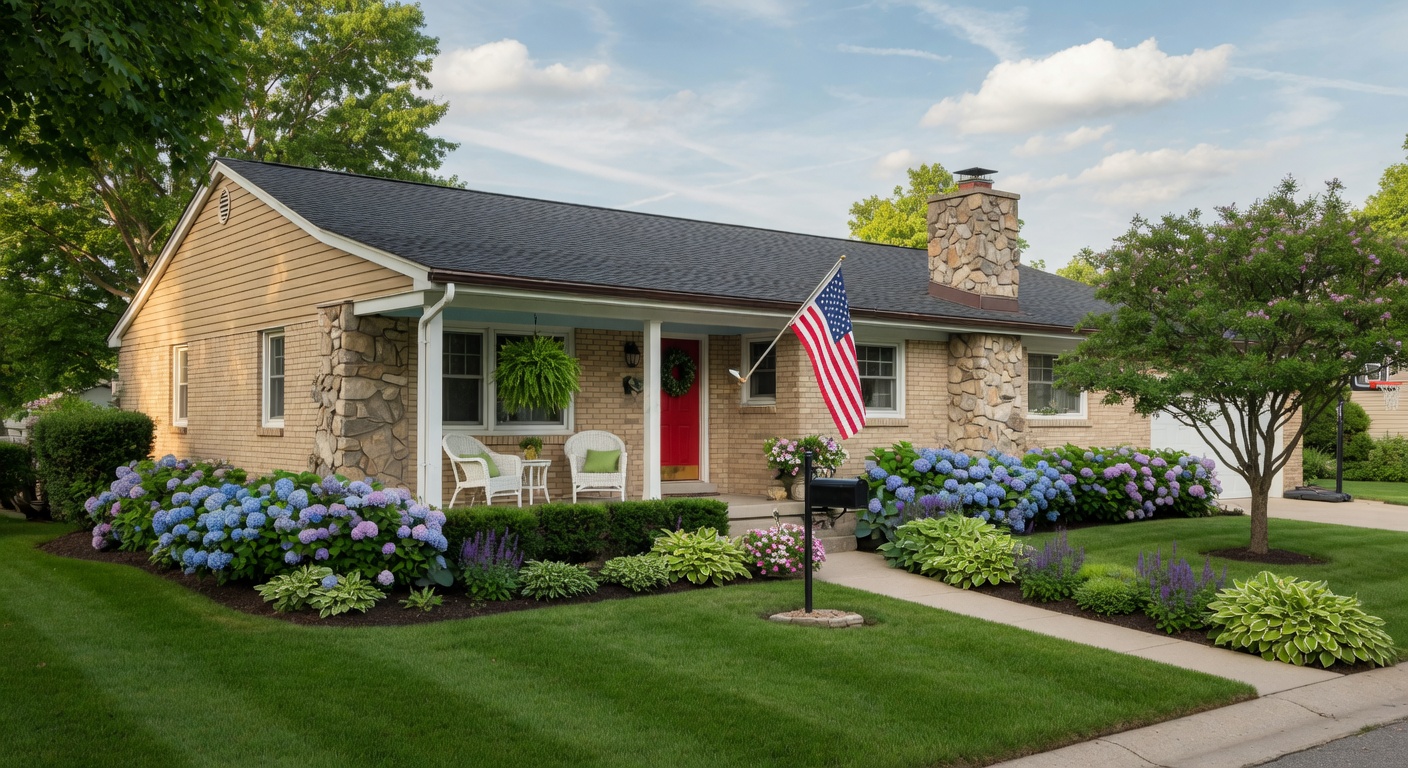
A lakeside community with a walkable downtown, local dining, and year-round recreation along the Genesee–Livingston border.

Argentine Township
Chain-of-lakes living with Lobdell Lake, rural character, and waterfront recreation along the Genesee–Livingston border.
Cohoctah
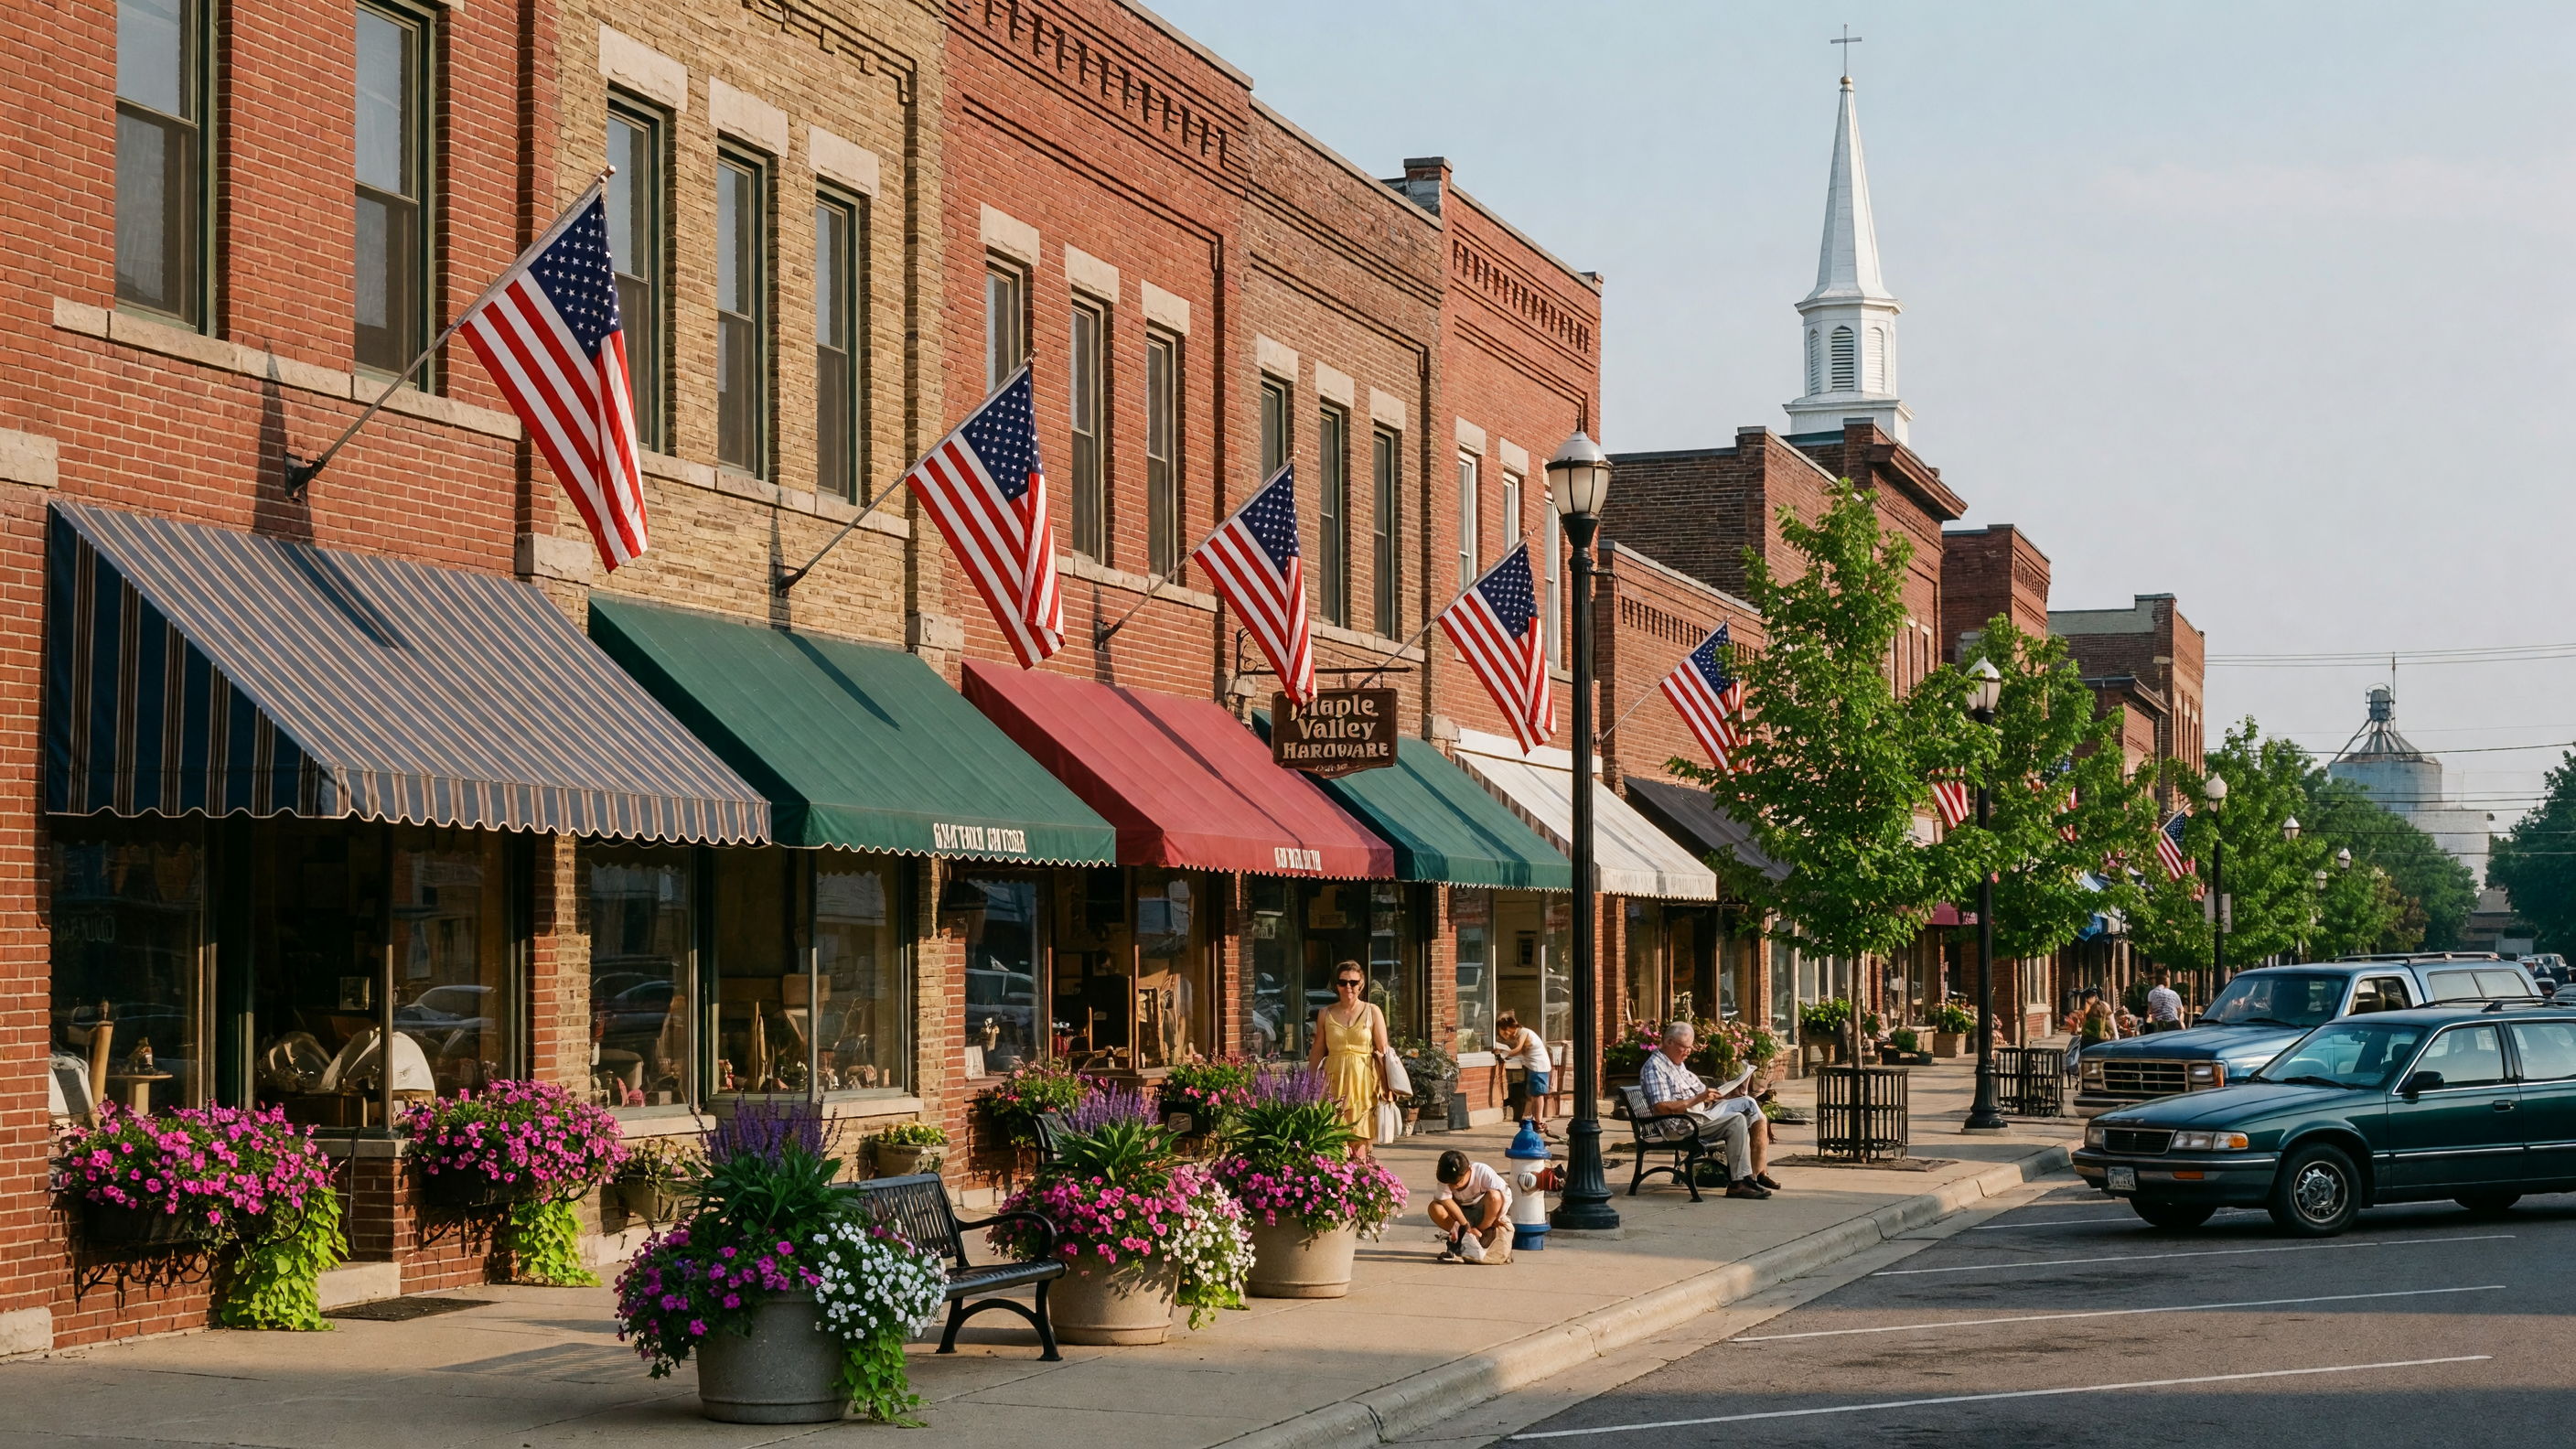
Livingston County's agricultural heartland — open farmland, custom homes, and a rural lifestyle.
Conway Township
An agricultural community with farmland, forests, and a country lifestyle in northwest Livingston County.
What Outdoor Activities Are Available in Livingston County?
Brighton Recreation Area
Nearly 5,000 acres of rolling hills, lakes, and 39 miles of multi-use trails for hiking, biking, skiing, and horseback riding in a state recreation area in Michigan.
Learn MoreIsland Lake State Recreation Area
Approximately 4,000 acres with over 20 miles of trails, a beach, paddling opportunities, and a balloon port along the Huron River.
Learn MoreKensington Metropark
Over 4,400 acres centered around Kent Lake with paved trails, beaches, a nature center, and year-round outdoor activities managed by the Huron-Clinton Metroparks.
Learn MoreHuron Meadows Metropark
A 1,576-acre park featuring a championship golf course, groomed cross-country ski trails, and scenic meadows along the Huron River.
Learn MoreCommon Questions About Livingston County, Michigan
Which Livingston County communities do buyers research most?
Brighton, Howell, and Hartland are among the frequently researched communities in Livingston County. Brighton offers a walkable downtown and easy access to I-96 and US-23, Howell serves as the county seat with a historic downtown, and Hartland has a residential layout and a large school district.
How far is Livingston County from Detroit and Ann Arbor?
Livingston County is positioned between Detroit and Ann Arbor along the I-96 and US-23 corridor. Brighton is roughly 45 to 60 miles from downtown Detroit and approximately 20 miles from Ann Arbor, making it convenient for commuters working in either metro area.
What are home prices in Livingston County?
As of September 2026, the median sold price for single-family homes in Livingston County was $440,000, the county's months of inventory stood at 2.24, and median days on market was 15 days (RPR, Realtors Property Resource, September 2026, Single Family). The county's home prices reflect its schools, outdoor recreation, and convenient location.
Livingston County Guides & Resources
Livingston County: The Suburban Sweet Spot
Why Livingston County is the suburban sweet spot between Ann Arbor and Detroit.
Relocation GuideLiving in Livingston County: A Complete Relocation Guide
Brighton, Hartland, Howell, Milford, and Pinckney — schools, commutes, recreation, and housing market insights.
First-Time BuyersLivingston County Guide for First-Time Home Buyers
Affordability, school districts, parks, and convenient commutes to Ann Arbor and Detroit.
Buyer GuideFirst-Time Home Buyer's Guide to Mid-Michigan
Pre-approval, closing costs, home inspections, and everything you need to know before buying your first home.
Weekend GetawaysWeekend Getaways Within Two Hours
Ann Arbor, Traverse City, island escapes, wine country, and small towns.
TaxesUnderstanding Property Taxes Across Mid-Michigan
Compare property tax rates and millage across Genesee, Oakland, Livingston, and neighboring counties.